Welcome to the May 2025 Chester County Real Estate Market Update! This month's report provides a comprehensive overview of the county's active housing market, building on the trends we observed in April. We continue to see strong buyer demand, reflected in homes selling quickly, with a median of just six days on the market—a consistent trend from the previous month. While the Sale Price-to-Original Price Ratio remains robust, indicating that homes are generally selling at or above their initial asking price, the increase in price reductions suggests that strategic pricing is more crucial than ever for sellers to stand out in a competitive landscape.
This report dives into key metrics including average and median sale prices, days on market, and financing trends, offering valuable insights for anyone looking to navigate the Chester County real estate scene. Explore the details below to understand the dynamics of this vibrant market and how it might impact your real estate goals. To understand how these trends impact your real estate goals, call Trago Realty today for a personalized consultation.
Market Insights: May 2025 Chester County Real Estate Market Report: Key Data Points
Here's a straightforward look at the Chester County Residential Real Estate Market activity for May 2025, based on the latest data:
Key Market Metrics:
Mortgage & Payment Types (May 2025):
Comparison to April 2025:
Key Observations:
Comparing May's performance to April 2025 reveals some interesting shifts in the Chester County market:
Overall, May continued the trend of a competitive seller's market in Chester County, characterized by quick sales and strong sale-to-original price ratios.
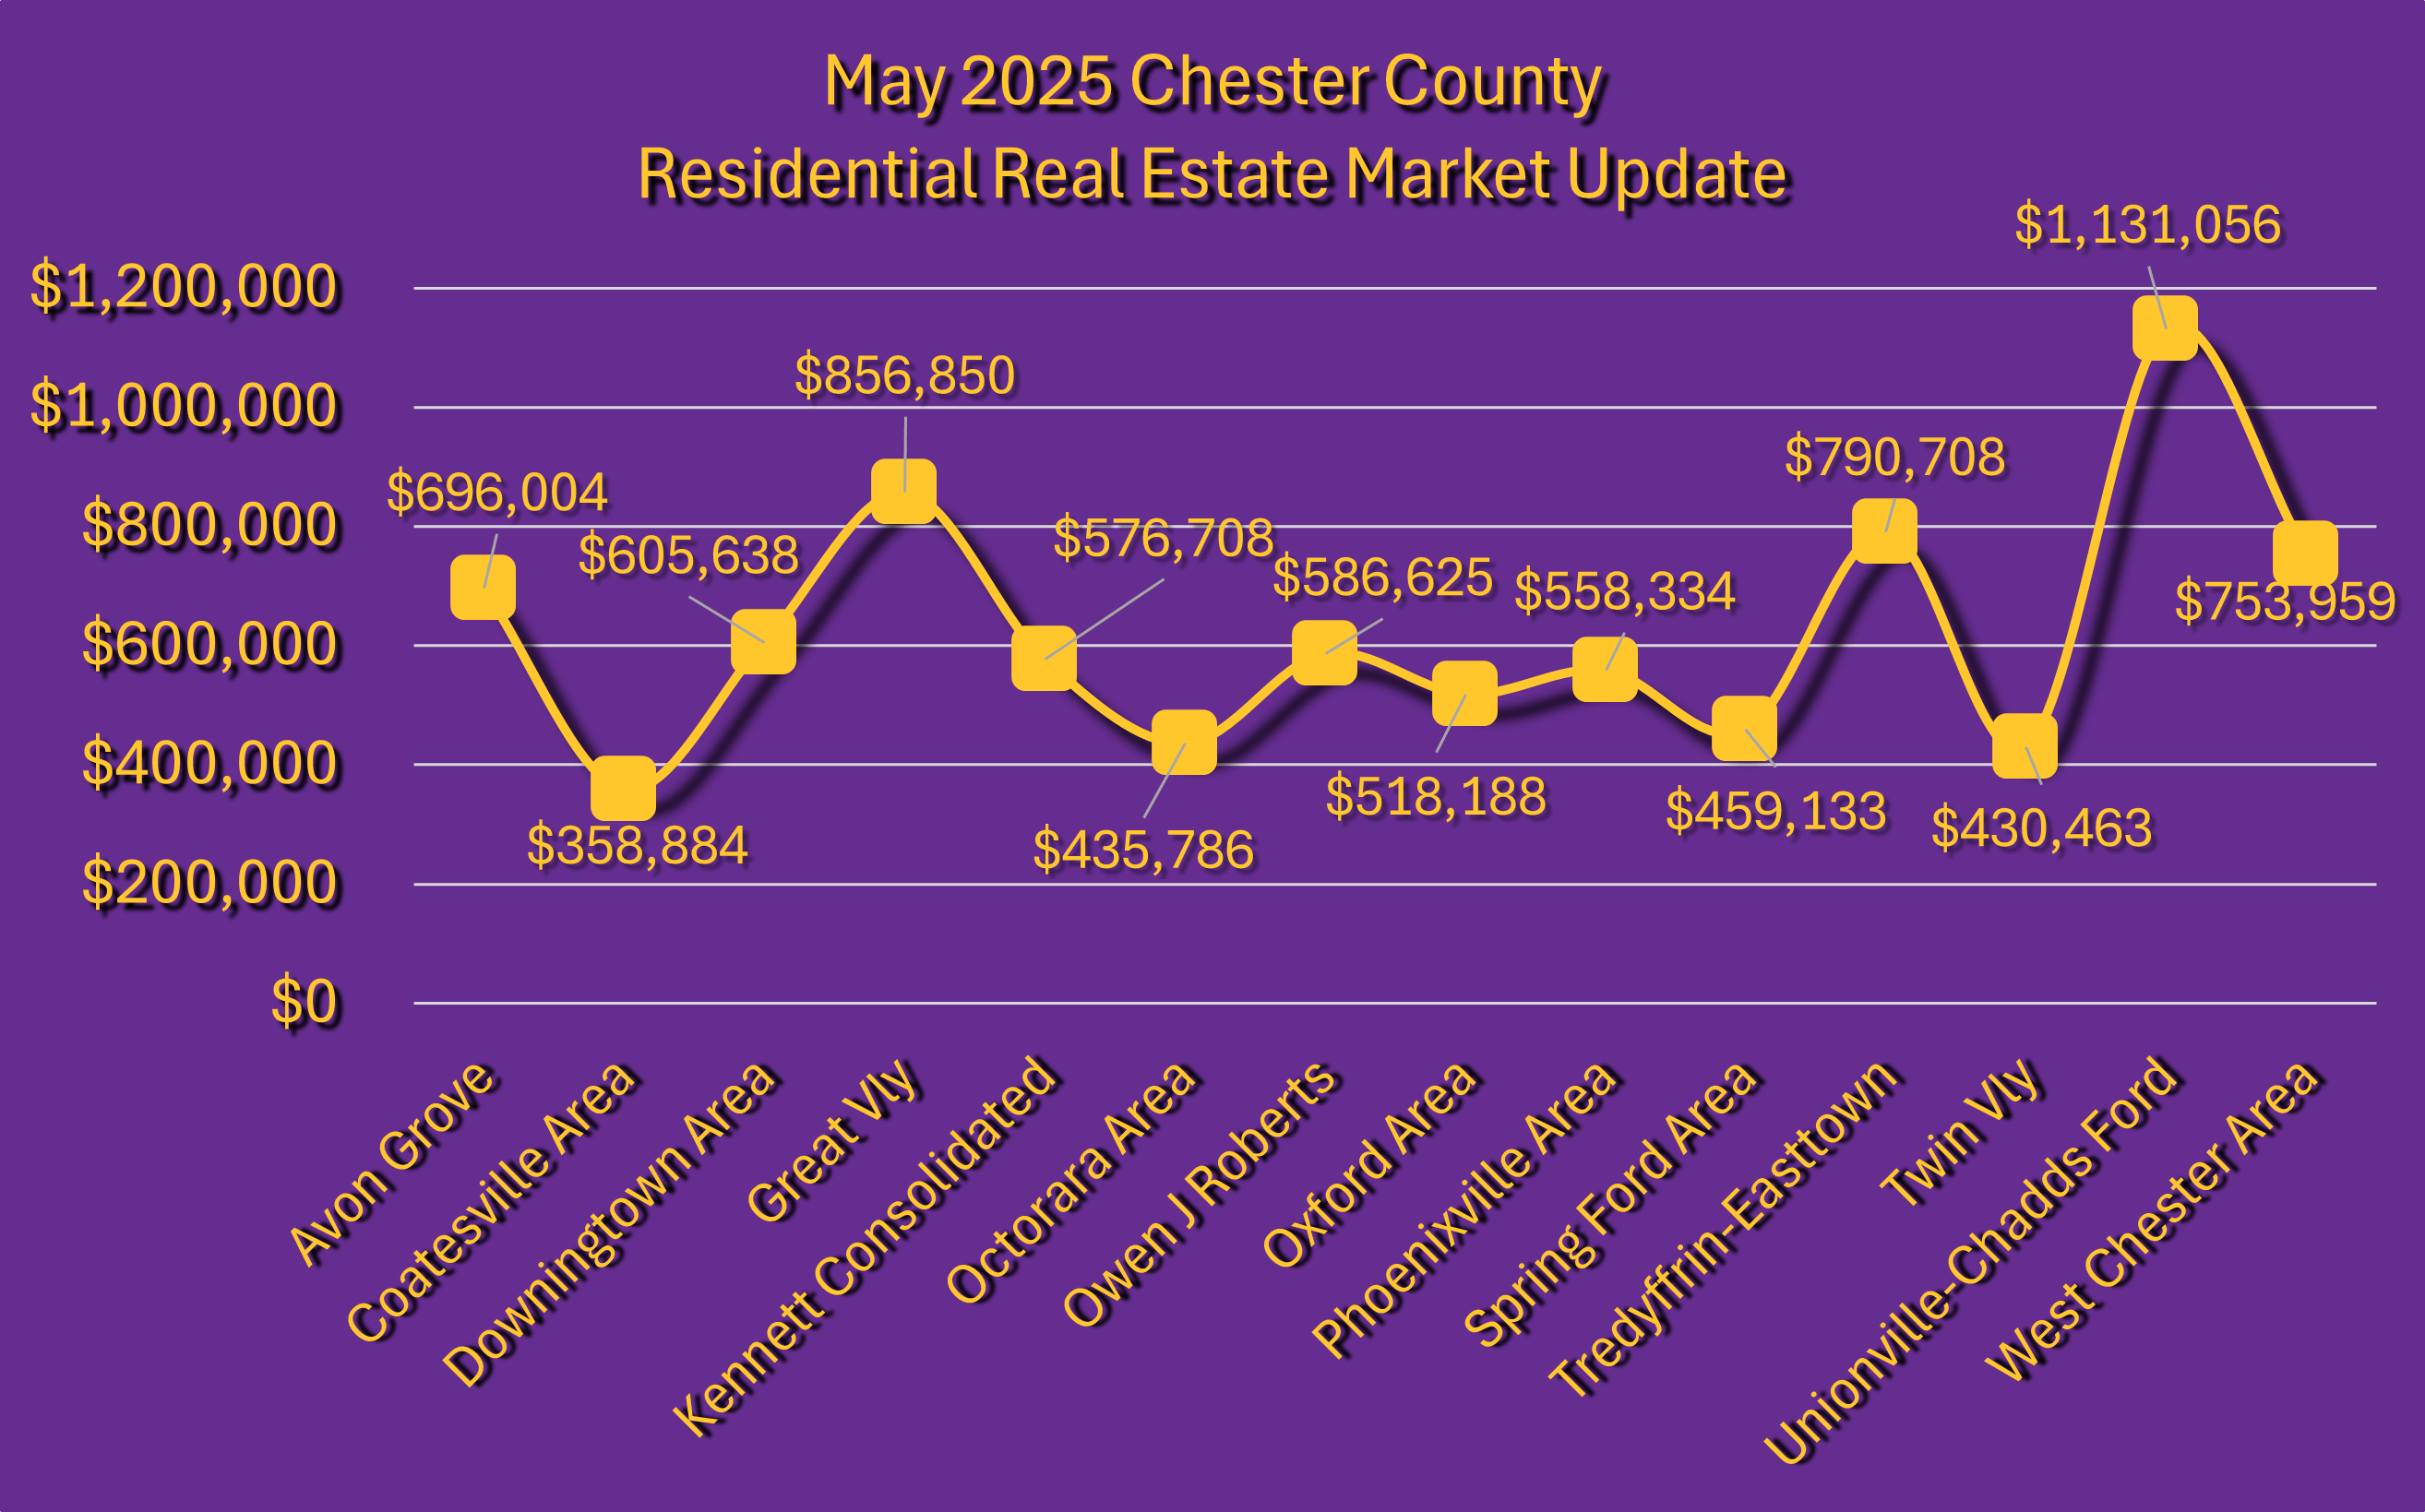
May 2025 Chester County by School District:
Here's a breakdown of residential real estate activity across Chester County's school districts for May 2025:
Avon Grove (20 Sales)
Avondale Borough (1 Sale): $205,000 | 91% | 25 days
Franklin Township (2 Sales): $581,588 | 102% | 10 days
London Britain Township (3 Sales): $970,667 | 98% | 56 days
London Grove Township (5 Sales): $429,980 | 101% | 9 days
New London Township (6 Sales): $1,052,167 | 94% | 75 days
Penn Township (2 Sales): $522,500 | 103% | 1 day
West Grove Borough (1 Sale): $132,000 | 91% | 67 days
Coatesville Area (57 Sales)
Caln Township (17 Sales): $348,671 | 103% | 17 days
Coatesville City (7 Sales): $216,643 | 98% | 12 days
East Fallowfield Township (5 Sales): $339,180 | 103% | 86 days
Sadsbury Township (3 Sales): $392,167 | 103% | 9 days
South Coatesville Borough (5 Sales): $376,996 | 99% | 12 days
Valley Township (13 Sales): $383,855 | 102% | 8 days
West Brandywine Township (4 Sales): $491,250 | 105% | 10 days
West Caln Township (3 Sales): $433,333 | 101% | 11 days
Downingtown Area (73 Sales)
Downingtown Borough (5 Sales): $404,980 | 105% | 21 days
East Brandywine Township (13 Sales): $572,300 | 102% | 74 days
East Caln Township (3 Sales): $348,333 | 104% | 12 days
Upper Uwchlan Township (10 Sales): $759,000 | 100% | 55 days
Uwchlan Township (17 Sales): $566,176 | 104% | 11 days
Wallace Township (5 Sales): $686,953 | 111% | 7 days
West Bradford Township (16 Sales): $583,875 | 103% | 44 days
West Pikeland Township (4 Sales): $927,500 | 100% | 100 days
Great Valley (45 Sales)
Charlestown Township (7 Sales): $857,786 | 97% | 24 days
East Whiteland Township (17 Sales): $842,432 | 101% | 23 days
Malvern Borough (3 Sales): $775,667 | 101% | 14 days
Willistown Township (18 Sales): $883,633 | 102% | 17 days
Kennett Consolidated (21 Sales)
East Marlboro Township (8 Sales): $692,125 | 100% | 8 days
Kennett Square Borough (3 Sales): $445,200 | 107% | 8 days
Kennett Township (5 Sales): $526,589 | 100% | 86 days
New Garden Township (5 Sales): $521,067 | 101% | 9 days
Octorara Area (15 Sales)
Atglen Borough (4 Sales): $480,841 | 105% | 27 days
Londonderry Township (3 Sales): $639,473 | 117% | 3 days
Parkesburg Borough (6 Sales): $303,333 | 99% | 46 days
West Fallowfield Township (1 Sale): $465,000 | 103% | 8 days
West Sadsbury Township (1 Sale): $410,000 | 100% | 9 days
Owen J Roberts (31 Sales)
East Coventry Township (5 Sales): $383,380 | 98% | 23 days
East Nantmeal Township (1 Sale): $1,350,000 | 97% | 178 days
East Vincent Township (8 Sales): $473,309 | 104% | 44 days
North Coventry Township (7 Sales): $456,714 | 103% | 20 days
South Coventry Township (4 Sales): $481,000 | 109% | 14 days
West Vincent Township (6 Sales): $1,001,833 | 102% | 59 days
Oxford Area (22 Sales)
East Nottingham Township (7 Sales): $516,043 | 108% | 8 days
Lower Oxford Township (6 Sales): $605,009 | 103% | 7 days
Oxford Borough (6 Sales): $472,965 | 113% | 18 days
Upper Oxford Township (3 Sales): $440,000 | 99% | 28 days
Phoenixville Area (41 Sales)
East Pikeland Township (8 Sales): $754,000 | 102% | 11 days
Phoenixville Borough (23 Sales): $410,938 | 101% | 19 days
Schuylkill Township (10 Sales): $740,813 | 103% | 16 days
Spring Ford Area (3 Sales)
Spring City Borough (3 Sales): $459,133 | 100% | 11 days
Tredyffrin-Easttown (53 Sales)
Easttown Township (13 Sales): $1,068,231 | 104% | 6 days
Tredyffrin Township (40 Sales): $700,513 | 105% | 12 days
Twin Valley (19 Sales)
Elverson Borough (2 Sales): $428,500 | 97% | 19 days
Honeybrook Borough (3 Sales): $272,833 | 86% | 12 days
Honeybrook Township (11 Sales): $439,390 | 118% | 22 days
West Nantmeal Township (3 Sales): $556,667 | 103% | 5 days
Unionville-Chadds Ford (9 Sales)
Birmingham Township (2 Sales): $966,000 | 106% | 5 days
Newlin Township (2 Sales): $1,062,500 | 105% | 1 day
Pennsbury Township (4 Sales): $1,105,625 | 93% | 94 days
Pocopson Township (1 Sale): $1,700,000 | 100% | 3 days
West Chester Area (119 Sales)
East Bradford Township (10 Sales): $949,000 | 100% | 10 days
East Goshen Township (20 Sales): $598,475 | 103% | 14 days
Thornbury Township (4 Sales): $833,250 | 98% | 45 days
West Chester Borough (18 Sales): $701,879 | 103% | 42 days
West Goshen Township (29 Sales): $810,924 | 103% | 9 days
West Whiteland Township (27 Sales): $754,920 | 101% | 9 days
Westtown Township (11 Sales): $763,193 | 104% | 18 days
May 2025 Chester County by School District Table:
The table presented as an image below visually represents the same sales data that is listed in the bullet points above. The table format organizes the information into rows and columns, which can sometimes make it easier to comprehend at a glance. However, the image-based table might be less accessible or clear for readers on mobile devices compared to the text-based bulleted list. Please reach out for a PDF version of the table to be emailed.

In summary, the Chester County residential real estate market in May 2025 demonstrated continued strength with higher sales volume and quick transactions. While average prices saw a slight increase and sale-to-original price ratios remained strong, the rise in price reductions signals the growing importance of competitive pricing in this active market.
Please feel free to reach out if you have any questions or would like a more detailed analysis of specific areas.
*All information in this report has been collected from Bright MLS and is deemed reliable but not guaranteed. The Broker makes no representations or warranties, express or implied, regarding the accuracy, completeness, or reliability of the data provided. This information is subject to errors, omissions, and data entry inaccuracies, including but not limited to those from cooperating brokers participating in Bright MLS. Additionally, this report does not account for off-market transactions, private sales, or transactions conducted outside of Bright MLS.
This report is for informational purposes only and should not be construed as real estate advice. Individual circumstances vary, and real estate decisions should be based on professional guidance tailored to your specific situation. Please contact Trago Realty or your real estate agent to discuss your particular situation and/or needs.