September 15, 2025
August 2025 West Chester Area School District Residential Real Estate Market Update
Market Overview (Quick Stats)
- Median Sale Price: $750,000
- Months of Inventory: 2
- Sale Price-to-Original Price Ratio: 100.30%
- CDOM Median: 6 days
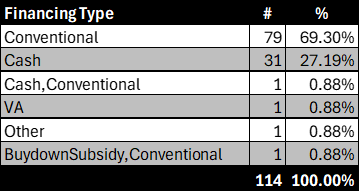
- Financing Shift: Cash up to 27.19% of sales
This month’s report provides an in-depth look at housing activity within the West Chester Area School District, focusing on the most important indicators shaping today’s real estate landscape: Months of Inventory, Sale Price-to-Original Price Ratio, Cumulative Days on Market (CDOM), Financing Trends, and Current Median Price.
We’ll also highlight closed sales and occupied rentals for August 2025 to give you a clear picture of how the local market is performing compared to July.
Market Insights
Months' Supply of Inventory
2 months – inventory remains tight, sustaining a strong seller’s market.
Sale Price-to-Original Price Ratio
100.30% – homes are still selling near asking price, but bidding wars appear to have cooled slightly.
Cumulative Days on Market (CDOM)
- Median: 6 days
- Average: 26 days
Properties are still moving quickly, though buyers are taking slightly longer compared to July’s rapid pace.
Pricing
- Current Price Median: $750,000 – steady, showing resilience in median pricing despite shifting demand.
- Current Price Average: $916,687 – nearly flat, suggesting stable pricing at the higher end of the market.
Financing Trends
August saw a notable shift in financing methods compared to July:
- Conventional Loans: 69.30%
- Cash Purchases: 27.19%
- VA / FHA / Other: 3.51%
👉 The big story: cash buyers remain a significant portion of the market, indicating continued competition from investors or buyers looking to avoid mortgage hurdles.
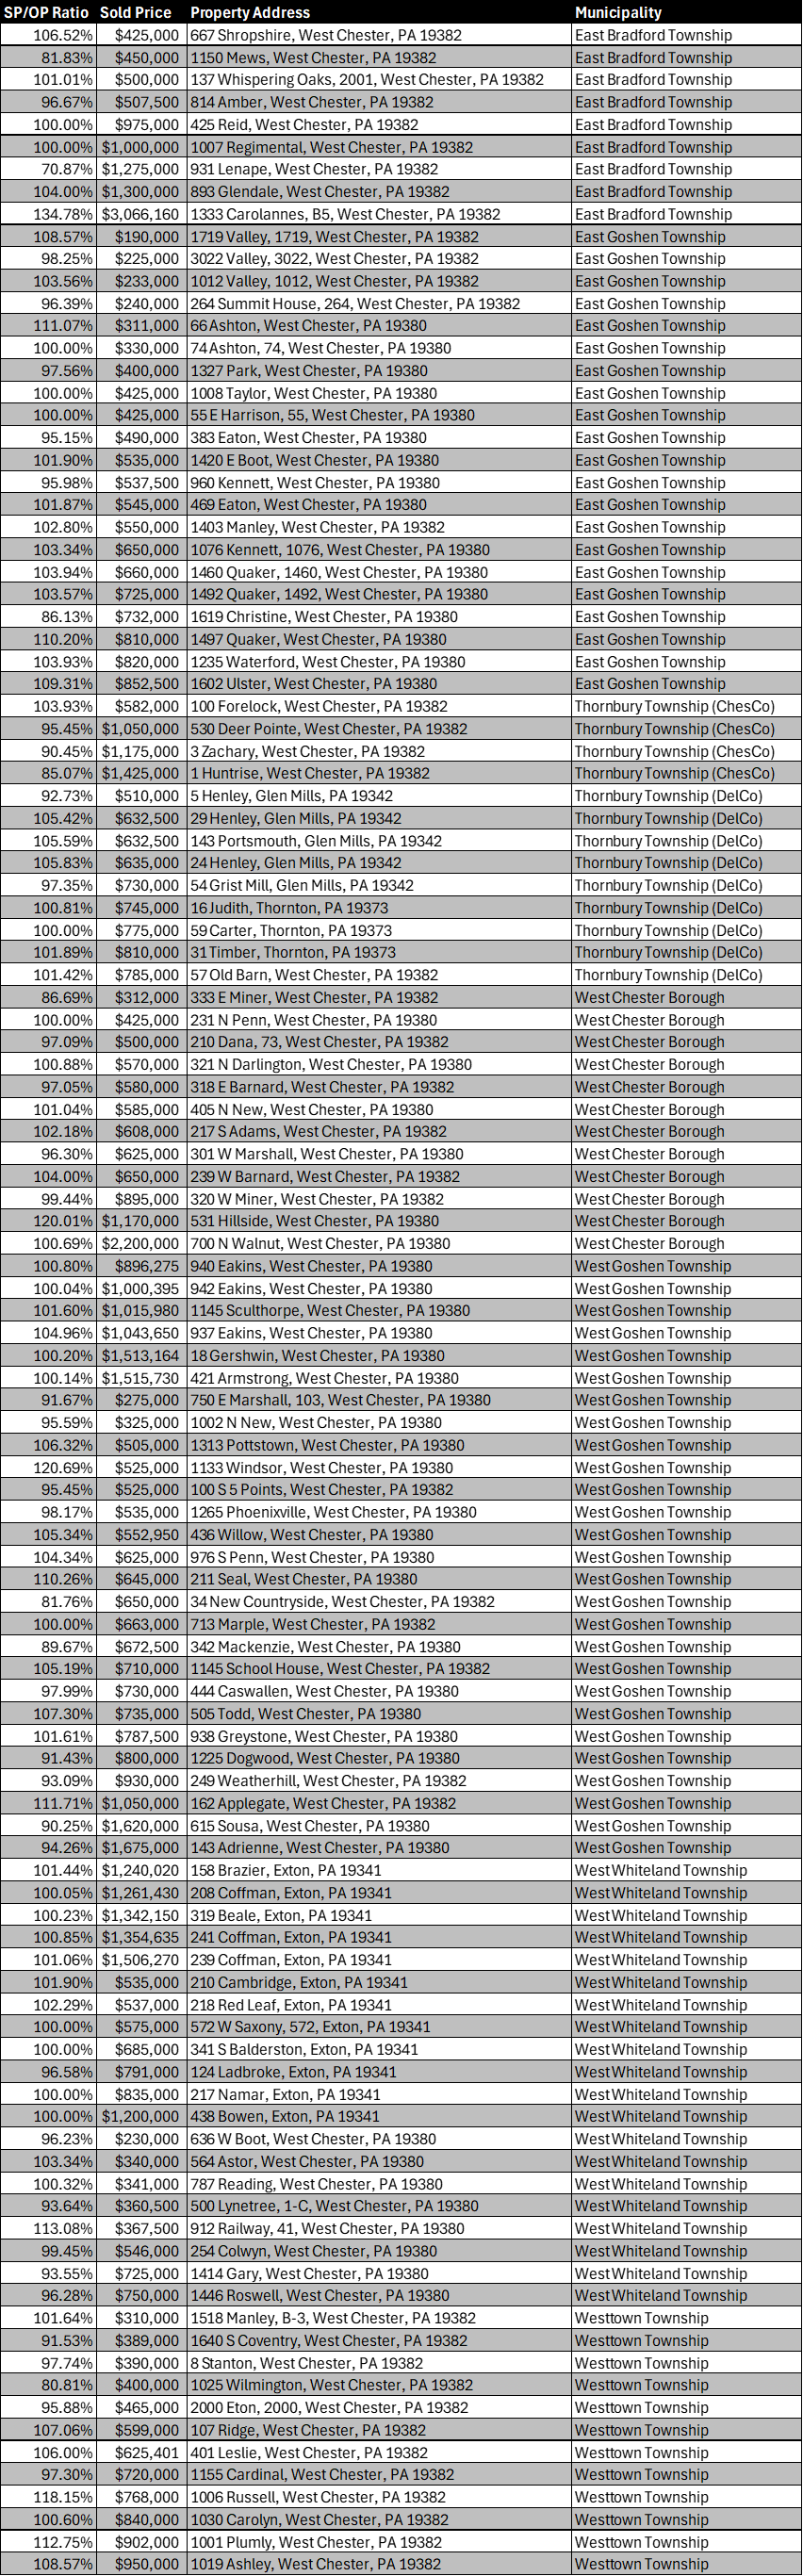
Sold Properties – August 2025
East Bradford Township
- 106.52% – $425,000 – 667 Shropshire, West Chester, PA 19382
- 81.83% – $450,000 – 1150 Mews, West Chester, PA 19382
- 101.01% – $500,000 – 137 Whispering Oaks, 2001, West Chester, PA 19382
- 96.67% – $507,500 – 814 Amber, West Chester, PA 19382
- 100.00% – $975,000 – 425 Reid, West Chester, PA 19382
- 100.00% – $1,000,000 – 1007 Regimental, West Chester, PA 19382
- 70.87% – $1,275,000 – 931 Lenape, West Chester, PA 19382
- 104.00% – $1,300,000 – 893 Glendale, West Chester, PA 19382
- 134.78% – $3,066,160 – 1333 Carolannes, B5, West Chester, PA 19382
East Goshen Township
- 108.57% – $190,000 – 1719 Valley, 1719, West Chester, PA 19382
- 98.25% – $225,000 – 3022 Valley, 3022, West Chester, PA 19382
- 103.56% – $233,000 – 1012 Valley, 1012, West Chester, PA 19382
- 96.39% – $240,000 – 264 Summit House, 264, West Chester, PA 19382
- 111.07% – $311,000 – 66 Ashton, West Chester, PA 19380
- 100.00% – $330,000 – 74 Ashton, West Chester, PA 19380
- 97.56% – $400,000 – 1327 Park, West Chester, PA 19380
- 100.00% – $425,000 – 1008 Taylor, West Chester, PA 19380
- 100.00% – $425,000 – 55 E Harrison, 55, West Chester, PA 19380
- 95.15% – $490,000 – 383 Eaton, West Chester, PA 19380
- 101.90% – $535,000 – 1420 E Boot, West Chester, PA 19380
- 95.98% – $537,500 – 960 Kennett, West Chester, PA 19380
- 101.87% – $545,000 – 469 Eaton, West Chester, PA 19380
- 102.80% – $550,000 – 1403 Manley, West Chester, PA 19382
- 103.34% – $650,000 – 1076 Kennett, 1076, West Chester, PA 19380
- 103.94% – $660,000 – 1460 Quaker, 1460, West Chester, PA 19380
- 103.57% – $725,000 – 1492 Quaker, 1492, West Chester, PA 19380
- 86.13% – $732,000 – 1619 Christine, West Chester, PA 19380
- 110.20% – $810,000 – 1497 Quaker, West Chester, PA 19380
- 103.93% – $820,000 – 1235 Waterford, West Chester, PA 19380
- 109.31% – $852,500 – 1602 Ulster, West Chester, PA 19380
Thornbury Township (ChesCo)
- 103.93% – $582,000 – 100 Forelock, West Chester, PA 19382
- 95.45% – $1,050,000 – 530 Deer Pointe, West Chester, PA 19382
- 90.45% – $1,175,000 – 3 Zachary, West Chester, PA 19382
- 85.07% – $1,425,000 – 1 Huntrise, West Chester, PA 19382
Thornbury Township (DelCo)
- 92.73% – $510,000 – 5 Henley, Glen Mills, PA 19342
- 105.42% – $632,500 – 29 Henley, Glen Mills, PA 19342
- 105.59% – $632,500 – 143 Portsmouth, Glen Mills, PA 19342
- 105.83% – $635,000 – 24 Henley, Glen Mills, PA 19342
- 97.35% – $730,000 – 54 Grist Mill, Glen Mills, PA 19342
- 100.81% – $745,000 – 16 Judith, Thornton, PA 19373
- 100.00% – $775,000 – 59 Carter, Thornton, PA 19373
- 101.89% – $810,000 – 31 Timber, Thornton, PA 19373
- 101.42% – $785,000 – 57 Old Barn, West Chester, PA 19382
West Chester Borough
- 86.69% – $312,000 – 333 E Miner, West Chester, PA 19382
- 100.00% – $425,000 – 231 N Penn, West Chester, PA 19380
- 97.09% – $500,000 – 210 Dana, 73, West Chester, PA 19382
- 100.88% – $570,000 – 321 N Darlington, West Chester, PA 19380
- 97.05% – $580,000 – 318 E Barnard, West Chester, PA 19382
- 101.04% – $585,000 – 405 N New, West Chester, PA 19380
- 102.18% – $608,000 – 217 S Adams, West Chester, PA 19382
- 96.30% – $625,000 – 301 W Marshall, West Chester, PA 19380
- 104.00% – $650,000 – 239 W Barnard, West Chester, PA 19382
- 99.44% – $895,000 – 320 W Miner, West Chester, PA 19382
- 120.01% – $1,170,000 – 531 Hillside, West Chester, PA 19380
- 100.69% – $2,200,000 – 700 N Walnut, West Chester, PA 19380
West Goshen Township
- 102.00% – $420,000 – 1209 Fern, West Chester, PA 19382
- 98.50% – $485,000 – 1432 Spruce, West Chester, PA 19382
- 101.75% – $540,000 – 1553 Birch, West Chester, PA 19382
West Whiteland Township
- 100.00% – $380,000 – 6 Ashbrook, West Chester, PA 19382
- 103.45% – $610,000 – 109 Glen, West Chester, PA 19382
- 95.20% – $725,000 – 320 Bridle, West Chester, PA 19382
Westtown Township
- 100.00% – $525,000 – 45 Maple, West Chester, PA 19382
- 102.50% – $640,000 – 67 Walnut, West Chester, PA 19382
Rental Properties Occupied – August 2025
East Bradford Township
- 618 Shropshire, West Chester, PA 19382 – 4 BDRMS, 3 Full Baths, 1 Half Bath – $2,950
- 791 Bradford, West Chester, PA 19382 – 3 BDRMS, 1 Full Bath, 1 Half Bath – $2,600
East Goshen Township
- 1433 Manley, West Chester, PA 19382 – 1 BDRM, 1 Full Bath – $1,775
- 208 Summit House, 208, West Chester, PA 19382 – 2 BDRMS, 1 Full Bath, 1 Half Bath – $2,000
Thornbury Township (ChesCo)
- 104 Huntteam, West Chester, PA 19382 – 3 BDRMS, 2 Full Baths, 1 Half Bath – $3,500
West Chester Borough
- 128 Justin, 53, West Chester, PA 19382 – 3 BDRMS, 2 Full Baths, 1 Half Bath – $3,350
- 131 Sharpless, West Chester, PA 19382 – 2 BDRMS, 1 Full Bath – $2,100

The August 2025 market shows stability in pricing and inventory, but a cooling in bidding intensity compared to July. The rise in cash transactions highlights increasing investor and non-financed buyer activity, which could shape the market moving into fall.
To learn how these trends affect your personal real estate goals, reach out to Trago Realty today for a customized consultation.
✅ Sign up for our Newsletter to stay updated on next month’s trends:
✅ Explore other August 2025 Market Reports:
Disclaimer:
All information in this report has been collected from Bright MLS and is deemed reliable but not guaranteed. The Broker makes no representations or warranties, express or implied, regarding the accuracy, completeness, or reliability of the data provided. This information is subject to errors, omissions, and data entry inaccuracies, including but not limited to those from cooperating brokers participating in Bright MLS. Additionally, this report does not account for off-market transactions, private sales, or transactions conducted outside of Bright MLS.
This report is for informational purposes only and should not be construed as real estate advice. Individual circumstances vary, and real estate decisions should be based on professional guidance tailored to your specific situation. Please contact Trago Realty or your real estate agent to discuss your particular situation and/or needs.
