August 12, 2025
July 2025 Chester County, PA Residential Real Estate Market Update
Welcome to the July 2025 Chester County Real Estate Market Update! Following a robust June, this month's report reveals a shift in market dynamics, with a mix of trends for both buyers and sellers to consider. While overall pricing metrics saw a slight increase, the number of closed sales and the sale price-to-original price ratio both experienced a dip, suggesting a slight moderation in the market's intensity. Homes, however, continue to move quickly with the "Days to Sell Median" remaining consistently low.
This report delves into key metrics including average and median sale prices, days on market, and financing trends, offering valuable insights for anyone looking to navigate the Chester County real estate scene. Explore the details below to understand the dynamics of this vibrant market and how it might impact your real estate goals. To understand how these trends impact your real estate goals, call Trago Realty today for a personalized consultation.
Market Insights: July 2025 Chester County Real Estate Market Report: Key Data Points
Here's a straightforward look at the Chester County Residential Real Estate Market activity for July 2025, based on the latest data:
Key Market Metrics:
- Current Price Average: $832,833
- Current Price Median: $599,945
- Months Supply of Inventory: 2 months
- Sale Price-to-Original Price Ratio: 101.00%
- Days to Sell Average: 20 days
- Days to Sell Median: 6 days
- Cumulative Days on Market Average: 22 days
- Cumulative Days on Market Median: 6 days
- Number of Price Reductions: 293
- Reduced Price-to-Original Ask Ratio Average: 93.76%
- Reduced Price-to-Original Ask Ratio Median: 95.84%
- Price Reduction Percentage From Original List Price Average: 6.24%
- Price Reduction Percentage From Original List Price Median: 4.16%
- Number of Closed Sales: 586
Mortgage & Payment Types (July 2025):
- Conventional: 68.55%
- Cash: 26.15%
- VA: 1.54%
- FHA: 1.20%
- Cash, Conventional: 1.03%
- PHFA: 0.51%
- Other: 0.34%
- FHA203b: 0.17%
- USDA: 0.17%
- Private: 0.17%
- Adjustable Rate Mortgage, Conventional: 0.17%
Comparison to June 2025
Comparing July's performance to June 2025 reveals some interesting shifts in the Chester County market:
Key Observations:
- Average Sale Price: The average sale price saw an increase from $812,677 in June to $832,833 in July.
- Median Sale Price: The median sale price experienced a slight increase from $599,000 in June to $599,945 in July.
- Months Supply of Inventory: Inventory remained consistent, holding steady at 2 months, still signaling a strong seller's market with very limited supply.
- Sale Price-to-Original Price Ratio: This metric saw a decrease, from 101.80% in June to 101.00% in July, indicating a slight softening in the pace of bidding wars and a closer alignment of sale prices to asking prices.
- Days on Market (Average & Median): Both average and median days on market saw slight changes. The average increased from 17 days in June to 20 days in July, while the median remained consistently low at 6 days, highlighting that the quickest sales are still happening at the same rapid pace. Cumulative Days on Market also increased from an average of 20 days in June to 22 days in July.
- Number of Price Reductions: A slight increase was observed, with 293 price reductions in July compared to 274 in June. This, coupled with the decrease in the sale-to-original price ratio, suggests sellers are adjusting their initial pricing strategies.
- Number of Closed Sales: July saw a decrease in closed sales, dropping to 586 from 661 in June. This points to a cooler market volume compared to the peak activity seen in the early summer months.
Overall, July continued to be a competitive market in Chester County. While the pace of sales and sale-to-original price ratios moderated from June, average prices held firm and even slightly increased, and homes that sold quickly still did so in a matter of days.
July 2025 Chester County, PA Residential Real Estate Market Update
Welcome to the July 2025 Chester County Real Estate Market Update! Following a robust June, this month's report reveals a shift in market dynamics, with a mix of trends for both buyers and sellers to consider. While overall pricing metrics saw a slight increase, the number of closed sales and the sale price-to-original price ratio both experienced a dip, suggesting a slight moderation in the market's intensity. Homes, however, continue to move quickly with the "Days to Sell Median" remaining consistently low.
This report delves into key metrics including average and median sale prices, days on market, and financing trends, offering valuable insights for anyone looking to navigate the Chester County real estate scene. Explore the details below to understand the dynamics of this vibrant market and how it might impact your real estate goals. To understand how these trends impact your real estate goals, call Trago Realty today for a personalized consultation.
Market Insights: July 2025 Chester County Real Estate Market Report: Key Data Points
Here's a straightforward look at the Chester County Residential Real Estate Market activity for July 2025, based on the latest data:
Key Market Metrics:
- Current Price Average: $832,833
- Current Price Median: $599,945
- Months Supply of Inventory: 2 months
- Sale Price-to-Original Price Ratio: 101.00%
- Days to Sell Average: 20 days
- Days to Sell Median: 6 days
- Cumulative Days on Market Average: 22 days
- Cumulative Days on Market Median: 6 days
- Number of Price Reductions: 293
- Reduced Price-to-Original Ask Ratio Average: 93.76%
- Reduced Price-to-Original Ask Ratio Median: 95.84%
- Price Reduction Percentage From Original List Price Average: 6.24%
- Price Reduction Percentage From Original List Price Median: 4.16%
- Number of Closed Sales: 586
Mortgage & Payment Types (July 2025):
- Conventional: 68.55%
- Cash: 26.15%
- VA: 1.54%
- FHA: 1.20%
- Cash, Conventional: 1.03%
- PHFA: 0.51%
- Other: 0.34%
- FHA203b: 0.17%
- USDA: 0.17%
- Private: 0.17%
- AdjustableRateMortgage,Conventional: 0.17%
Comparison to June 2025
Comparing July's performance to June 2025 reveals some interesting shifts in the Chester County market:
Key Observations:
- Average Sale Price: The average sale price saw an increase from $812,677 in June to $832,833 in July.
- Median Sale Price: The median sale price experienced a slight increase from $599,000 in June to $599,945 in July.
- Months Supply of Inventory: Inventory remained consistent, holding steady at 2 months, still signaling a strong seller's market with very limited supply.
- Sale Price-to-Original Price Ratio: This metric saw a decrease, from 101.80% in June to 101.00% in July, indicating a slight softening in the pace of bidding wars and a closer alignment of sale prices to asking prices.
- Days on Market (Average & Median): Both average and median days on market saw slight changes. The average increased from 17 days in June to 20 days in July, while the median remained consistently low at 6 days, highlighting that the quickest sales are still happening at the same rapid pace. Cumulative Days on Market also increased from an average of 20 days in June to 22 days in July.
- Number of Price Reductions: A slight increase was observed, with 293 price reductions in July compared to 274 in June. This, coupled with the decrease in the sale-to-original price ratio, suggests sellers are adjusting their initial pricing strategies.
- Number of Closed Sales: July saw a decrease in closed sales, dropping to 586 from 661 in June. This points to a cooler market volume compared to the peak activity seen in the early summer months.
Overall, July continued to be a competitive market in Chester County. While the pace of sales and sale-to-original price ratios moderated from June, average prices held firm and even slightly increased, and homes that sold quickly still did so in a matter of days.
July 2025 Chester County by School District: Summary Data
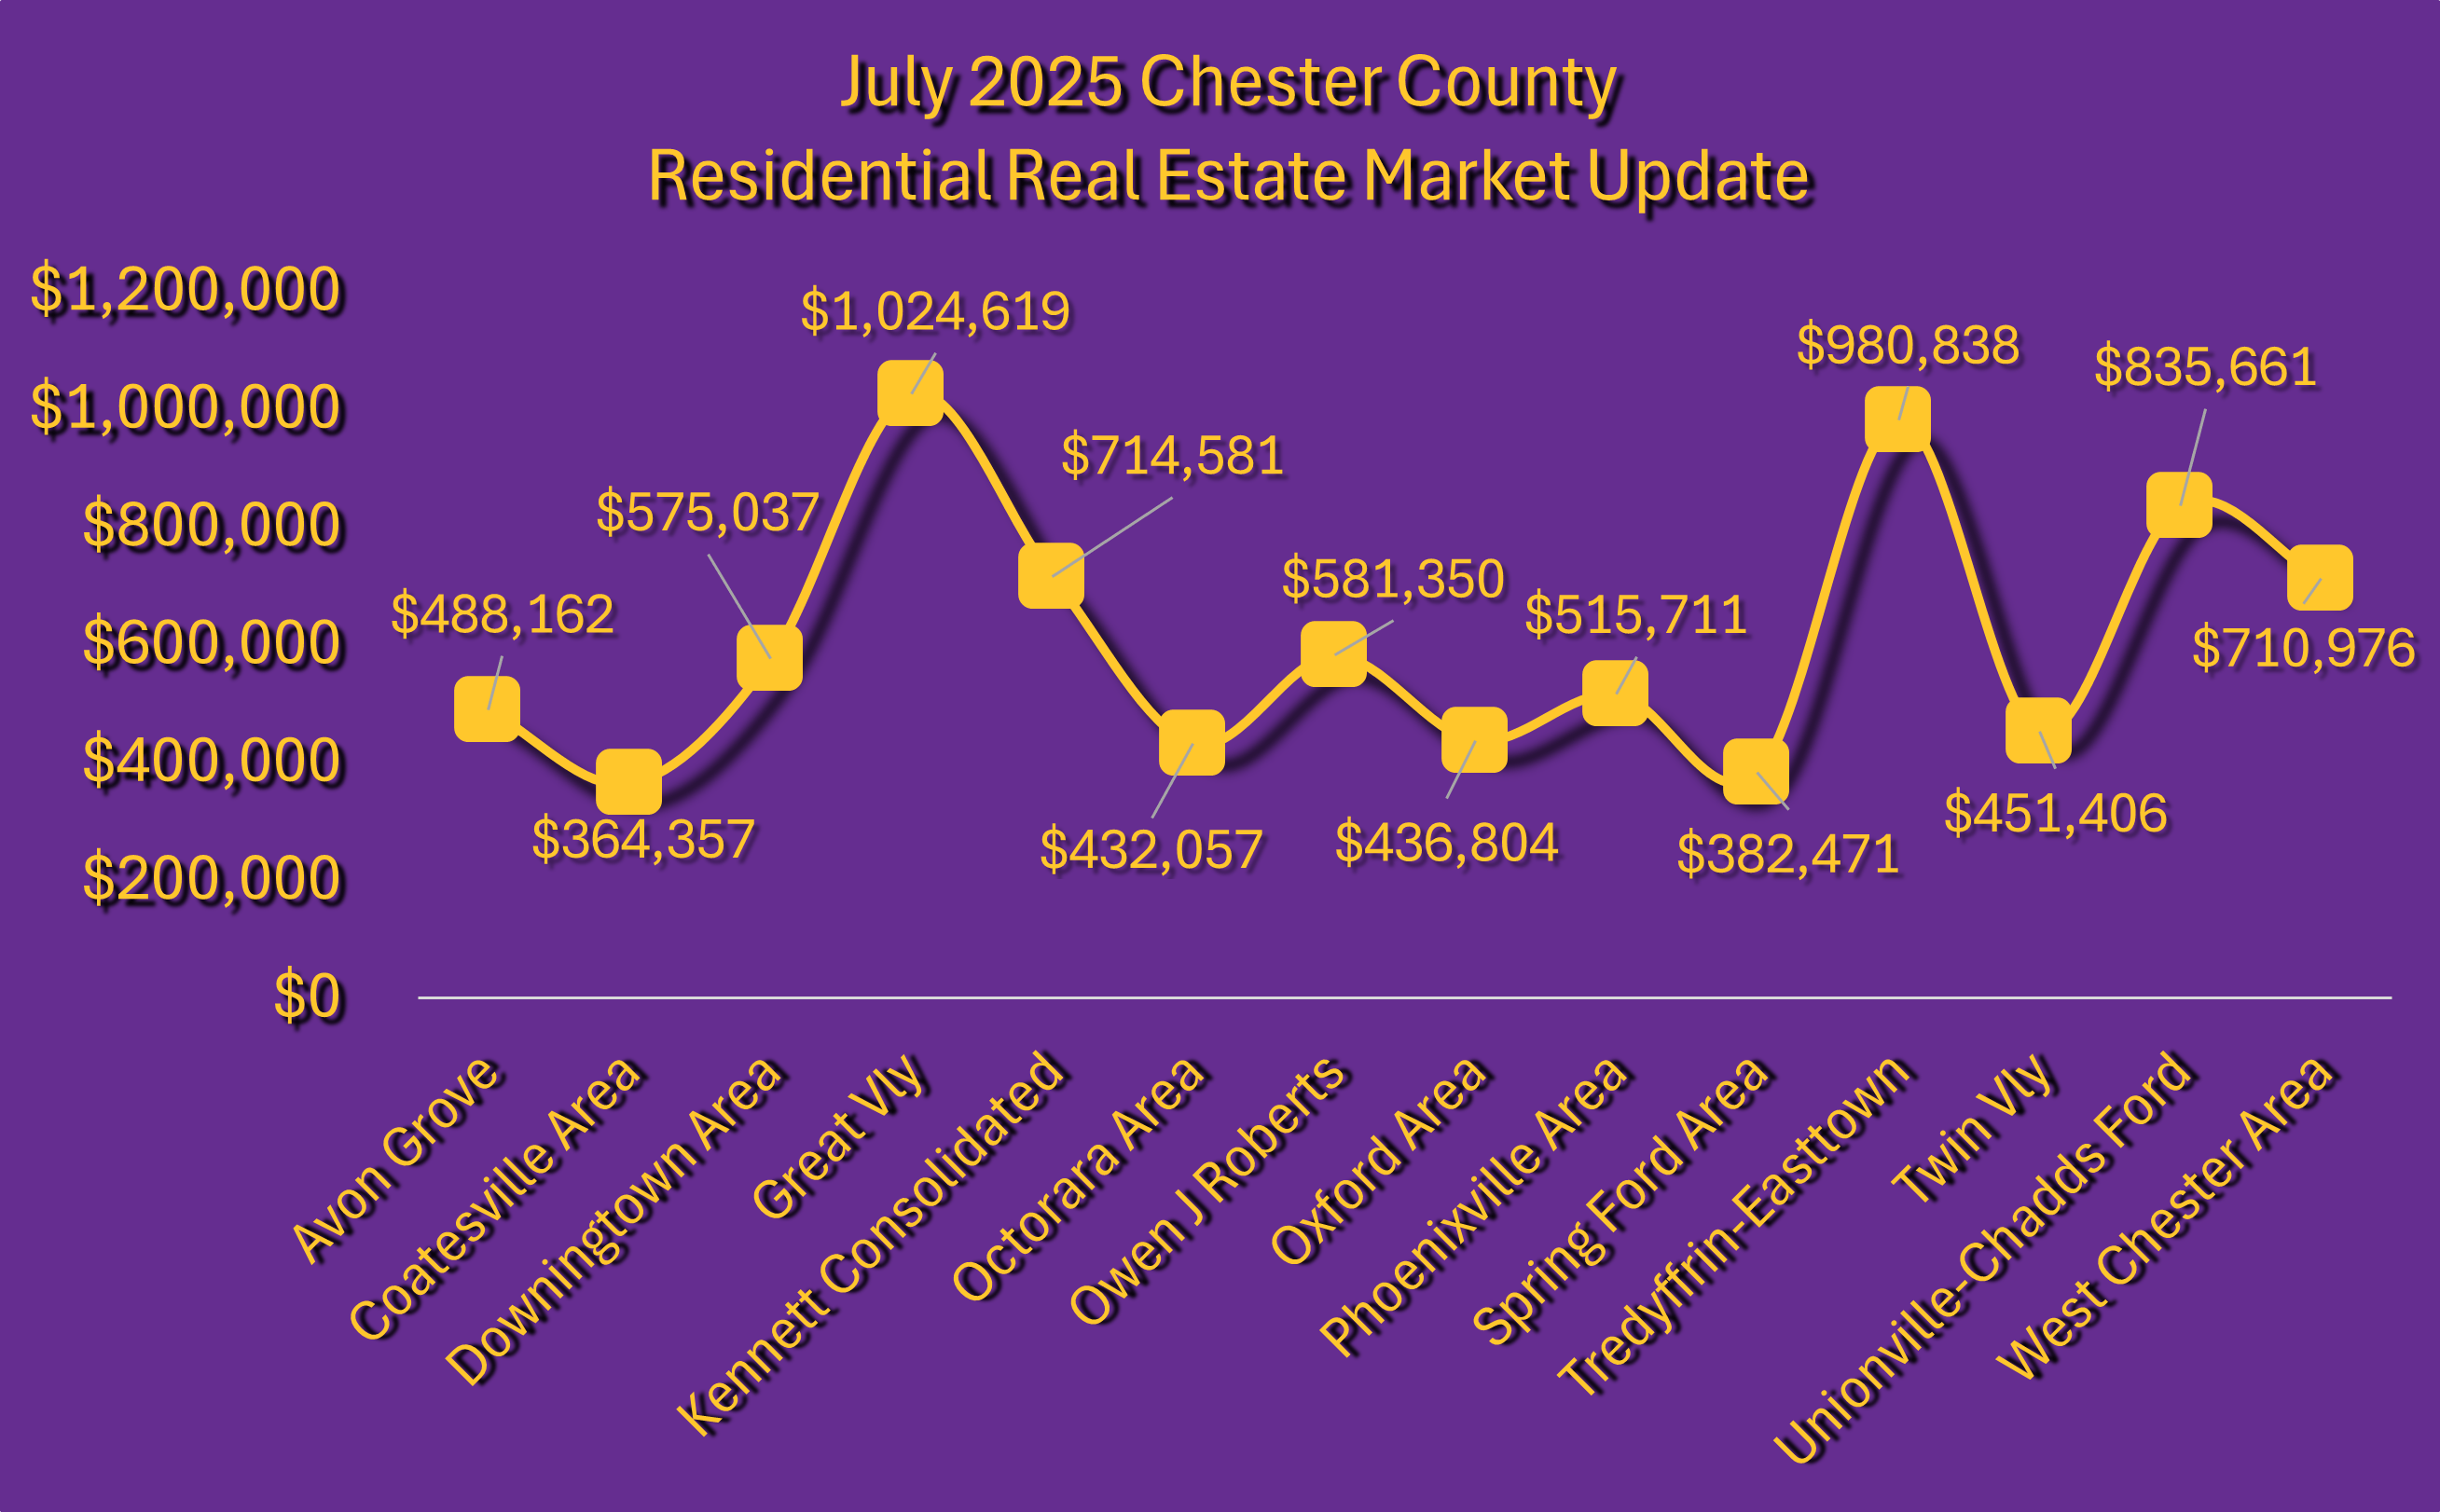
Here's a summary breakdown of residential real estate activity across Chester County's school districts for July 2025:
- Avon Grove: 30 Sales | $488,162 Average Sold Price
- Coatesville Area: 71 Sales | $364,357 Average Sold Price
- Downingtown Area: 83 Sales | $575,037 Average Sold Price
- Great Valley: 31 Sales | $1,024,619 Average Sold Price
- Kennett Consolidated: 36 Sales | $714,581 Average Sold Price
- Octorara Area: 13 Sales | $432,057 Average Sold Price
- Owen J Roberts: 37 Sales | $581,350 Average Sold Price
- Oxford Area: 22 Sales | $436,804 Average Sold Price
- Phoenixville Area: 42 Sales | $515,711 Average Sold Price
- Spring Ford Area: 9 Sales | $382,471 Average Sold Price
- Tredyffrin-Easttown: 57 Sales | $980,838 Average Sold Price
- Twin Valley: 17 Sales | $451,406 Average Sold Price
- Unionville-Chadds Ford: 16 Sales | $835,661 Average Sold Price
- West Chester Area: 121 Sales | $710,976 Average Sold Price

July 2025 Residential Sales by School District and Township:
This section provides a detailed breakdown of individual residential sales within each school district and its corresponding townships/boroughs for July 2025.
- CDOM = Cumulative Days on Market
- SP/OP = Sold Price-to-Original Price Ratio
Avon Grove School District
Total Sales Volume: $14,644,865
Franklin Township (3 Sales):
- 102 Sunset Landenberg, PA 19350 | CDOM: 5 | SP/OP: 100.00% | Sold Price: $499,900
- 126 Peacedale Landenberg, PA 19350 | CDOM: 41 | SP/OP: 88.14% | Sold Price: $260,000
- 153 Janine West Grove, PA 19390 | CDOM: 35 | SP/OP: 96.64% | Sold Price: $575,000
London Britain Township (4 Sales):
- 102 Foxbrook Landenberg, PA 19350 | CDOM: 15 | SP/OP: 98.02% | Sold Price: $490,000
- 11 Windsor Court Landenberg, PA 19350 | CDOM: 10 | SP/OP: 99.28% | Sold Price: $690,000
- 118 Stoney Ridge Landenberg, PA 19350 | CDOM: 4 | SP/OP: 112.26% | Sold Price: $650,000
- 129 Glennann Landenberg, PA 19350 | CDOM: 6 | SP/OP: 94.74% | Sold Price: $450,000
London Grove Township (6 Sales):
- 3 Buttonwood West Grove, PA 19390 | CDOM: 2 | SP/OP: 109.11% | Sold Price: $431,000
- 30 Abby Avondale, PA 19311 | CDOM: 3 | SP/OP: 105.90% | Sold Price: $720,000
- 4 Airdale West Grove, PA 19390 | CDOM: 7 | SP/OP: 98.10% | Sold Price: $515,000
- 416 Coote Avondale, PA 19311 | CDOM: 2 | SP/OP: 105.49% | Sold Price: $675,000
- 423 Westview Avondale, PA 19311 | CDOM: 238 | SP/OP: 88.17% | Sold Price: $507,000
- 7 Nova West Grove, PA 19390 | CDOM: 4 | SP/OP: 116.88% | Sold Price: $450,000
New London Township (5 Sales):
- 1015 Oxford Lincoln University, PA 19352 | CDOM: 4 | SP/OP: 100.00% | Sold Price: $420,000
- 1110 Thunder Hill Lincoln University, PA 19352 | CDOM: 2 | SP/OP: 111.23% | Sold Price: $723,000
- 116 Hodgson Lincoln University, PA 19352 | CDOM: 4 | SP/OP: 106.90% | Sold Price: $775,000
- 205 Clearview Lincoln University, PA 19352 | CDOM: 28 | SP/OP: 93.75% | Sold Price: $450,000
- 443 Pennocks Bridge West Grove, PA 19390 | CDOM: 39 | SP/OP: 91.85% | Sold Price: $400,000
Penn Township (10 Sales):
- 244 Letitia Manor West Grove, PA 19390 | CDOM: 1 | SP/OP: 100.00% | Sold Price: $467,635
- 310 Guglielma Springett West Grove, PA 19390 | CDOM: 1 | SP/OP: 100.00% | Sold Price: $486,775
- 327 Mcneil West Grove, PA 19390 | CDOM: 76 | SP/OP: 91.86% | Sold Price: $450,000
- 333 Guglielma Springett West Grove, PA 19390 | CDOM: 1 | SP/OP: 100.00% | Sold Price: $578,455
- 417 Richard Penn West Grove, PA 19390 | CDOM: 308 | SP/OP: 100.00% | Sold Price: $538,200
- 508 Christiana Manor West Grove, PA 19390 | CDOM: 68 | SP/OP: 97.79% | Sold Price: $550,000
- 600 Strawbridge West Grove, PA 19390 | CDOM: 217 | SP/OP: 97.26% | Sold Price: $355,000
- 716 W Glenview West Grove, PA 19390 | CDOM: 11 | SP/OP: 100.00% | Sold Price: $374,900
- 757 W Glenview West Grove, PA 19390 | CDOM: 2 | SP/OP: 100.87% | Sold Price: $358,000
- 99 Village West Grove, PA 19390 | CDOM: 28 | SP/OP: 79.31% | Sold Price: $115,000
West Grove Borough (2 Sales):
- 115 Jackson West Grove, PA 19390 | CDOM: 5 | SP/OP: 103.17% | Sold Price: $325,000
- 27 Winterset West Grove, PA 19390 | CDOM: 2 | SP/OP: 112.31% | Sold Price: $365,000
Coatesville Area School District
Total Sales Volume: $25,869,354
Caln Township (17 Sales):
- 1028 Aris Pear Way Downingtown, PA 19335 | CDOM: 4 | SP/OP: 100.00% | Sold Price: $515,000
- 1149 S Red Maple Downingtown, PA 19335 | CDOM: 12 | SP/OP: 96.17% | Sold Price: $500,000
- 122 Argyll Downingtown, PA 19335 | CDOM: 4 | SP/OP: 120.51% | Sold Price: $265,000
- 122 Chester Downingtown, PA 19335 | CDOM: 3 | SP/OP: 103.51% | Sold Price: $295,000
- 1255 S Red Maple Downingtown, PA 19335 | CDOM: 3 | SP/OP: 102.13% | Sold Price: $485,000
- 1350 Reed Coatesville, PA 19320 | CDOM: 5 | SP/OP: 114.89% | Sold Price: $321,575
- 143 Ascot Downingtown, PA 19335 | CDOM: 3 | SP/OP: 109.66% | Sold Price: $285,000
- 2558 Dupont Coatesville, PA 19320 | CDOM: 7 | SP/OP: 117.65% | Sold Price: $200,000
- 27 Williams Downingtown, PA 19335 | CDOM: 13 | SP/OP: 90.57% | Sold Price: $335,000
- 3345 Alydar Downingtown, PA 19335 | CDOM: 23 | SP/OP: 92.31% | Sold Price: $600,000
- 366 Jennifer Coatesville, PA 19320 | CDOM: 8 | SP/OP: 92.86% | Sold Price: $325,000
- 3707 E Fisherville Downingtown, PA 19335 | CDOM: 340 | SP/OP: 52.08% | Sold Price: $250,000
- 400 Lloyd Downingtown, PA 19335 | CDOM: 4 | SP/OP: 108.00% | Sold Price: $567,000
- 4009 Katie Downingtown, PA 19335 | CDOM: 3 | SP/OP: 104.47% | Sold Price: $538,000
- 488 Devon Downingtown, PA 19335 | CDOM: 3 | SP/OP: 103.45% | Sold Price: $300,000
- 604 Norma Thorndale, PA 19372 | CDOM: 5 | SP/OP: 102.27% | Sold Price: $450,000
- 618 Lancaster Downingtown, PA 19335 | CDOM: 6 | SP/OP: 98.25% | Sold Price: $280,000
Coatesville City (11 Sales):
- 1030 Oak Coatesville, PA 19320 | CDOM: 4 | SP/OP: 106.00% | Sold Price: $371,000
- 122 S 8Th Coatesville, PA 19320 | CDOM: 47 | SP/OP: 100.51% | Sold Price: $196,000
- 131 Country Run Coatesville, PA 19320 | CDOM: 9 | SP/OP: 101.50% | Sold Price: $345,000
- 132 Millview Coatesville, PA 19320 | CDOM: 5 | SP/OP: 116.71% | Sold Price: $350,000
- 133 Millview Coatesville, PA 19320 | CDOM: 5 | SP/OP: 107.76% | Sold Price: $350,219
- 205 Walnut Coatesville, PA 19320 | CDOM: 27 | SP/OP: 95.65% | Sold Price: $143,000
- 340 Valley Coatesville, PA 19320 | CDOM: 0 | SP/OP: 100.00% | Sold Price: $150,000
- 417 N 8Th Coatesville, PA 19320 | CDOM: 17 | SP/OP: 99.64% | Sold Price: $249,000
- 420 Walnut Coatesville, PA 19320 | CDOM: 30 | SP/OP: 88.92% | Sold Price: $289,000
- 527 Cedar Coatesville, PA 19320 | CDOM: 6 | SP/OP: 102.70% | Sold Price: $380,000
- 834 Coates Coatesville, PA 19320 | CDOM: 32 | SP/OP: 90.52% | Sold Price: $190,000
East Fallowfield Township (5 Sales):
- 104 John Stevens Coatesville, PA 19320 | CDOM: 18 | SP/OP: 95.15% | Sold Price: $480,500
- 131 Bridle Path Coatesville, PA 19320 | CDOM: 9 | SP/OP: 100.40% | Sold Price: $627,500
- 1336 Old Wilmington Coatesville, PA 19320 | CDOM: 2 | SP/OP: 108.00% | Sold Price: $405,000
- 345 Trotters Coatesville, PA 19320 | CDOM: 4 | SP/OP: 106.30% | Sold Price: $457,000
- 47 Narragansett Coatesville, PA 19320 | CDOM: 18 | SP/OP: 110.03% | Sold Price: $385,000
Modena Borough (1 Sale):
- 6 Woodland Modena, PA 19358 | CDOM: 4 | SP/OP: 100.05% | Sold Price: $190,000
Sadsbury Township (4 Sales):
- 305 Fox Parkesburg, PA 19365 | CDOM: 4 | SP/OP: 104.73% | Sold Price: $288,000
- 312 Trego Coatesville, PA 19320 | CDOM: 6 | SP/OP: 100.00% | Sold Price: $449,000
- 465 Trego Coatesville, PA 19320 | CDOM: 6 | SP/OP: 98.97% | Sold Price: $480,000
- 510 Green Hill Parkesburg, PA 19365 | CDOM: 4 | SP/OP: 103.39% | Sold Price: $305,000
South Coatesville Borough (3 Sales):
- 18 Lafayette Coatesville, PA 19320 | CDOM: 18 | SP/OP: 87.28% | Sold Price: $205,000
- 40 Remington Coatesville, PA 19320 | CDOM: 7 | SP/OP: 103.30% | Sold Price: $191,100
- 53 Lukens Mill Coatesville, PA 19320 | CDOM: 5 | SP/OP: 103.24% | Sold Price: $350,000
Valley Township (13 Sales):
- 102 Beacon Coatesville, PA 19320 | CDOM: 4 | SP/OP: 105.60% | Sold Price: $396,000
- 12 Donna Coatesville, PA 19320 | CDOM: 2 | SP/OP: 101.09% | Sold Price: $278,000
- 150 Hamilton Coatesville, PA 19320 | CDOM: 1 | SP/OP: 100.00% | Sold Price: $330,000
- 182 Dague Farm Coatesville, PA 19320 | CDOM: 5 | SP/OP: 110.00% | Sold Price: $440,000
- 2 Putter Coatesville, PA 19320 | CDOM: 3 | SP/OP: 114.35% | Sold Price: $263,000
- 208 Gilmer Valley Township, PA 19320 | CDOM: 5 | SP/OP: 140.38% | Sold Price: $365,000
- 235 Hamilton Coatesville, PA 19320 | CDOM: 16 | SP/OP: 100.00% | Sold Price: $334,990
- 239 Hamilton Coatesville, PA 19320 | CDOM: 36 | SP/OP: 100.00% | Sold Price: $329,990
- 242 Bardel Coatesville, PA 19320 | CDOM: 3 | SP/OP: 107.28% | Sold Price: $311,000
- 243 Hamilton Coatesville, PA 19320 | CDOM: 1 | SP/OP: 100.00% | Sold Price: $344,630
- 268 Gaston Coatesville, PA 19320 | CDOM: 4 | SP/OP: 101.20% | Sold Price: $420,000
- 34 Rose Glen Coatesville, PA 19320 | CDOM: 22 | SP/OP: 95.71% | Sold Price: $335,000
- 524 Gilmer Coatesville, PA 19320 | CDOM: 5 | SP/OP: 101.27% | Sold Price: $400,000
West Brandywine Township (8 Sales):
- 116 Wynnewood Coatesville, PA 19320 | CDOM: 29 | SP/OP: 95.35% | Sold Price: $410,000
- 15 Castle Coatesville, PA 19320 | CDOM: 5 | SP/OP: 100.00% | Sold Price: $375,000
- 16 Michael Coatesville, PA 19320 | CDOM: 20 | SP/OP: 100.80% | Sold Price: $630,000
- 160 Cedar Knoll Coatesville, PA 19320 | CDOM: 12 | SP/OP: 100.03% | Sold Price: $350,000
- 252 Hibernia Coatesville, PA 19320 | CDOM: 5 | SP/OP: 110.00% | Sold Price: $297,000
- 52 Ottawa Honey Brook, PA 19344 | CDOM: 21 | SP/OP: 100.00% | Sold Price: $55,000
- 52 Reason Coatesville, PA 19320 | CDOM: 3 | SP/OP: 106.38% | Sold Price: $425,000
- 648 E Reeceville Rd Coatesville, PA 19320 | CDOM: 6 | SP/OP: 102.96% | Sold Price: $695,000
West Caln Township (9 Sales):
- 103 Cornwall Coatesville, PA 19320 | CDOM: 7 | SP/OP: 100.66% | Sold Price: $460,990
- 105 Andy Jane Coatesville, PA 19320 | CDOM: 4 | SP/OP: 106.69% | Sold Price: $351,000
- 113 Cornwall Coatesville, PA 19320 | CDOM: 57 | SP/OP: 99.76% | Sold Price: $407,990
- 115 Cornwall Coatesville, PA 19320 | CDOM: 57 | SP/OP: 101.24% | Sold Price: $407,990
- 120 Cornwall Coatesville, PA 19320 | CDOM: 15 | SP/OP: 99.89% | Sold Price: $447,490
- 130 Davis Coatesville, PA 19320 | CDOM: 6 | SP/OP: 114.13% | Sold Price: $525,000
- 130 Durham Coatesville, PA 19320 | CDOM: 16 | SP/OP: 101.39% | Sold Price: $466,390
- 200 Brookview Coatesville, PA 19320 | CDOM: 25 | SP/OP: 100.00% | Sold Price: $225,000
- 3211 Compass Honey Brook, PA 19344 | CDOM: 37 | SP/OP: 182.00% | Sold Price: $455,000
Downingtown Area School District
Total Sales Volume: $47,728,045
Downingtown Borough (7 Sales):
- 154 E Church Downingtown, PA 19335 | CDOM: 6 | SP/OP: 100.00% | Sold Price: $220,000
- 237 Washington Downingtown, PA 19335 | CDOM: 27 | SP/OP: 85.76% | Sold Price: $299,980
- 322 Jefferson 24 Downingtown, PA 19335 | CDOM: 3 | SP/OP: 104.62% | Sold Price: $340,000
- 335 E Lancaster A13 Downingtown, PA 19335 | CDOM: 5 | SP/OP: 109.68% | Sold Price: $170,000
- 335 E Lancaster F2 Downingtown, PA 19335 | CDOM: 2 | SP/OP: 102.16% | Sold Price: $189,000
- 422 Garfield Downingtown, PA 19335 | CDOM: 4 | SP/OP: 106.25% | Sold Price: $340,000
- 432 William Downingtown, PA 19335 | CDOM: 6 | SP/OP: 108.62% | Sold Price: $353,000
East Brandywine Township (14 Sales):
- 1100 Horseshoe Downingtown, PA 19335 | CDOM: 7 | SP/OP: 100.00% | Sold Price: $625,000
- 116 Constitution Downingtown, PA 19335 | CDOM: 5 | SP/OP: 107.87% | Sold Price: $480,000
- 133 Ridgewood Downingtown, PA 19335 | CDOM: 6 | SP/OP: 104.50% | Sold Price: $580,000
- 203 Heritage Downingtown, PA 19335 | CDOM: 16 | SP/OP: 100.00% | Sold Price: $669,000
- 221 N Caldwell Downingtown, PA 19335 | CDOM: 3 | SP/OP: 102.52% | Sold Price: $610,000
- 305 S Caldwell Downingtown, PA 19335 | CDOM: 12 | SP/OP: 96.87% | Sold Price: $712,000
- 31 Hastings Downingtown, PA 19335 | CDOM: 8 | SP/OP: 101.33% | Sold Price: $380,000
- 327 S Caldwell Downingtown, PA 19335 | CDOM: 40 | SP/OP: 97.27% | Sold Price: $679,900
- 350 Zynn Downingtown, PA 19335 | CDOM: 6 | SP/OP: 103.85% | Sold Price: $405,000
- 4 Wyndham Downingtown, PA 19335 | CDOM: 5 | SP/OP: 103.72% | Sold Price: $279,000
- 5 Quail Hill Downingtown, PA 19335 | CDOM: 4 | SP/OP: 112.03% | Sold Price: $801,000
- 502 Rock Raymond Downingtown, PA 19335 | CDOM: 11 | SP/OP: 83.17% | Sold Price: $262,000
- 507 Scarlett Maple Downingtown, PA 19335 | CDOM: 107 | SP/OP: 103.45% | Sold Price: $449,990
- 509 Scarlet Maple Downingtown, PA 19335 | CDOM: 1 | SP/OP: 100.00% | Sold Price: $466,795
East Caln Township (10 Sales):
- 107 Four Leaf Downingtown, PA 19335 | CDOM: 19 | SP/OP: 94.77% | Sold Price: $521,108
- 12 Cypress Downingtown, PA 19335 | CDOM: 4 | SP/OP: 103.00% | Sold Price: $412,000
- 203 Terra Vista Downingtown, PA 19335 | CDOM: 8 | SP/OP: 105.38% | Sold Price: $685,000
- 21 Lincoln Downingtown, PA 19335 | CDOM: 5 | SP/OP: 105.07% | Sold Price: $562,000
- 215 Downing Downingtown, PA 19335 | CDOM: 5 | SP/OP: 106.15% | Sold Price: $621,000
- 242 Tall Trees Downingtown, PA 19335 | CDOM: 4 | SP/OP: 107.53% | Sold Price: $500,000
- 270 W Uwchlan LOT #15 Downingtown, PA 19335 | CDOM: 184 | SP/OP: 82.35% | Sold Price: $70,000
- 297 Tall Trees Downingtown, PA 19335 | CDOM: 5 | SP/OP: 101.44% | Sold Price: $492,000
- 400 Campbell G20 Downingtown, PA 19335 | CDOM: 0 | SP/OP: 100.00% | Sold Price: $278,000
- 9 Oak Leaf Downingtown, PA 19335 | CDOM: 5 | SP/OP: 108.04% | Sold Price: $430,000
Upper Uwchlan Township (11 Sales):
- 106 Magnolia Chester Springs, PA 19425 | CDOM: 6 | SP/OP: 105.14% | Sold Price: $920,000
- 109 Norman Glenmoore, PA 19343 | CDOM: 3 | SP/OP: 102.50% | Sold Price: $717,500
- 2206 Mallard Downingtown, PA 19335 | CDOM: 8 | SP/OP: 100.02% | Sold Price: $500,000
- 305 Driftwood Downingtown, PA 19335 | CDOM: 9 | SP/OP: 95.58% | Sold Price: $430,000
- 32 Fetters Blvd Downingtown, PA 19335 | CDOM: 83 | SP/OP: 75.88% | Sold Price: $645,000
- 42 Fox Hollow Downingtown, PA 19335 | CDOM: 2 | SP/OP: 107.41% | Sold Price: $725,000
- 421 Mcgraw Lane Glenmoore, PA 19343 | CDOM: 62 | SP/OP: 100.00% | Sold Price: $535,000
- 512 Larkins Bridge Downingtown, PA 19335 | CDOM: 4 | SP/OP: 105.00% | Sold Price: $525,000
- 593 Trifecta Road Lot 331 Downingtown, PA 19335 | CDOM: 143 | SP/OP: 102.72% | Sold Price: $649,995
- 802 Mount Rose Chester Springs, PA 19425 | CDOM: 5 | SP/OP: 103.28% | Sold Price: $567,000
- 814 Paddock Downingtown, PA 19335 | CDOM: 193 | SP/OP: 94.79% | Sold Price: $635,000
Uwchlan Township (18 Sales):
- 109 Hickory Downingtown, PA 19335 | CDOM: 6 | SP/OP: 103.14% | Sold Price: $825,000
- 112 Lakeview Exton, PA 19341 | CDOM: 6 | SP/OP: 106.67% | Sold Price: $480,000
- 115 Aberdare Exton, PA 19341 | CDOM: 6 | SP/OP: 101.18% | Sold Price: $430,000
- 133 Andover Exton, PA 19341 | CDOM: 4 | SP/OP: 118.56% | Sold Price: $575,000
- 134 Neyland Exton, PA 19341 | CDOM: 3 | SP/OP: 101.20% | Sold Price: $420,000
- 2002 Bridgewater Chester Springs, PA 19425 | CDOM: 2 | SP/OP: 108.36% | Sold Price: $390,000
- 212 Woodward Exton, PA 19341 | CDOM: 5 | SP/OP: 108.34% | Sold Price: $785,439
- 323 Penwyllt Exton, PA 19341 | CDOM: 7 | SP/OP: 108.75% | Sold Price: $435,000
- 3809 Davis Chester Springs, PA 19425 | CDOM: 6 | SP/OP: 101.89% | Sold Price: $377,000
- 403 Saint Albans Chester Springs, PA 19425 | CDOM: 0 | SP/OP: 105.88% | Sold Price: $360,000
- 404 Worthington Exton, PA 19341 | CDOM: 6 | SP/OP: 103.15% | Sold Price: $360,000
- 460 Shelmire Downingtown, PA 19335 | CDOM: 7 | SP/OP: 103.07% | Sold Price: $608,000
- 464 Creekside Downingtown, PA 19335 | CDOM: 3 | SP/OP: 104.81% | Sold Price: $765,000
- 604 Wexford Downingtown, PA 19335 | CDOM: 5 | SP/OP: 106.68% | Sold Price: $656,111
- 615 Nancy Jane Downingtown, PA 19335 | CDOM: 2 | SP/OP: 111.25% | Sold Price: $890,000
- 714 Brainerd Exton, PA 19341 | CDOM: 5 | SP/OP: 103.72% | Sold Price: $725,000
- 821 Tremont Downingtown, PA 19335 | CDOM: 6 | SP/OP: 100.67% | Sold Price: $906,000
- 825 Williamsburg Downingtown, PA 19335 | CDOM: 25 | SP/OP: 101.66% | Sold Price: $859,000
Wallace Township (4 Sales):
- 10 Bassett Hunt Glenmoore, PA 19343 | CDOM: 179 | SP/OP: 92.31% | Sold Price: $1,200,000
- 15 Steepleview Glenmoore, PA 19343 | CDOM: 5 | SP/OP: 98.30% | Sold Price: $865,000
- 251 Highspire Glenmoore, PA 19343 | CDOM: 4 | SP/OP: 103.34% | Sold Price: $650,000
- 81 Brittany Glenmoore, PA 19343 | CDOM: 6 | SP/OP: 100.00% | Sold Price: $799,000
West Bradford Township (14 Sales):
- 1039 Pine West Chester, PA 19380 | CDOM: 13 | SP/OP: 96.67% | Sold Price: $72,500
- 1046 Appleville West Chester, PA 19380 | CDOM: 11 | SP/OP: 85.81% | Sold Price: $133,000
- 1205 Delaware Downingtown, PA 19335 | CDOM: 5 | SP/OP: 109.71% | Sold Price: $521,000
- 1303 Creagh Knoll Downingtown, PA 19335 | CDOM: 2 | SP/OP: 102.30% | Sold Price: $450,000
- 1306 Spellman Downingtown, PA 19335 | CDOM: 6 | SP/OP: 107.96% | Sold Price: $529,000
- 1325 W Strasburg West Chester, PA 19382 | CDOM: 54 | SP/OP: 100.00% | Sold Price: $325,000
- 1340 Shadyside Downingtown, PA 19335 | CDOM: 5 | SP/OP: 97.14% | Sold Price: $340,000
- 1411 Steeple Chase Downingtown, PA 19335 | CDOM: 4 | SP/OP: 107.86% | Sold Price: $700,000
- 1417 Manorwood West Chester, PA 19382 | CDOM: 6 | SP/OP: 90.00% | Sold Price: $405,000
- 1819 W Strasburg West Chester, PA 19382 | CDOM: 4 | SP/OP: 93.58% | Sold Price: $510,000
- 1919 Boulder Downingtown, PA 19335 | CDOM: 5 | SP/OP: 106.00% | Sold Price: $530,000
- 2050 Marion Coatesville, PA 19320 | CDOM: 26 | SP/OP: 99.09% | Sold Price: $545,000
- 506 Northbrook West Chester, PA 19382 | CDOM: 6 | SP/OP: 105.56% | Sold Price: $475,000
- 805 Bunny West Chester, PA 19382 | CDOM: 0 | SP/OP: 134.87% | Sold Price: $1,197,227
West Pikeland Township (5 Sales):
- 1081 Yellow Springs Chester Springs, PA 19425 | CDOM: 7 | SP/OP: 92.86% | Sold Price: $1,300,000
- 1736 Valley Chester Springs, PA 19425 | CDOM: 23 | SP/OP: 92.95% | Sold Price: $790,000
- 53 Devyn Chester Springs, PA 19425 | CDOM: 12 | SP/OP: 100.00% | Sold Price: $1,000,000
- 732 Fox Chester Springs, PA 19425 | CDOM: 7 | SP/OP: 99.61% | Sold Price: $637,500
- 965 Seven Oaks Chester Springs, PA 19425 | CDOM: 213 | SP/OP: 90.81% | Sold Price: $2,175,000
Great Valley School District
Total Sales Volume: $31,763,199
Charlestown Township (3 Sales):
- 101 Charlestown Hunt Phoenixville, PA 19460 | CDOM: 11 | SP/OP: 95.00% | Sold Price: $950,000
- 103 Stratford Malvern, PA 19355 | CDOM: 28 | SP/OP: 96.48% | Sold Price: $545,000
- 388 Quigley Malvern, PA 19355 | CDOM: 4 | SP/OP: 108.33% | Sold Price: $910,000
East Whiteland Township (11 Sales):
- 1 Granville Exton, PA 19341 | CDOM: 4 | SP/OP: 100.00% | Sold Price: $689,000
- 1 Winding Malvern, PA 19355 | CDOM: 2 | SP/OP: 114.00% | Sold Price: $741,000
- 10 Devonshire Malvern, PA 19355 | CDOM: 4 | SP/OP: 115.05% | Sold Price: $1,605,000
- 10 Elkins Exton, PA 19341 | CDOM: 3 | SP/OP: 111.14% | Sold Price: $889,000
- 10 Elliston Exton, PA 19341 | CDOM: 3 | SP/OP: 104.59% | Sold Price: $617,000
- 105 Bacton Hill LOT 2 Malvern, PA 19355 | CDOM: 268 | SP/OP: 107.19% | Sold Price: $911,136
- 147 Mulberry Malvern, PA 19355 | CDOM: 6 | SP/OP: 106.05% | Sold Price: $615,000
- 153 Weybridge Malvern, PA 19355 | CDOM: 3 | SP/OP: 105.15% | Sold Price: $510,000
- 34 Broad Leaf Malvern, PA 19355 | CDOM: 8 | SP/OP: 101.38% | Sold Price: $810,000
- 401 Blue Welsh Malvern, PA 19355 | CDOM: 26 | SP/OP: 96.80% | Sold Price: $605,000
- 628 Cliff Malvern, PA 19355 | CDOM: 4 | SP/OP: 103.15% | Sold Price: $659,100
Malvern Borough (1 Sale):
- 110 Bridge Malvern, PA 19355 | CDOM: 28 | SP/OP: 98.86% | Sold Price: $870,000
Willistown Township (16 Sales):
- 10 Stonehenge Malvern, PA 19355 | CDOM: 2 | SP/OP: 103.42% | Sold Price: $910,000
- 116 Manor Paoli, PA 19301 | CDOM: 5 | SP/OP: 105.38% | Sold Price: $490,000
- 118 Chapel Hill Paoli, PA 19301 | CDOM: 84 | SP/OP: 93.33% | Sold Price: $1,470,000
- 13 Stoneybrook Malvern, PA 19355 | CDOM: 3 | SP/OP: 100.00% | Sold Price: $1,250,000
- 16 Redtail 107 West Chester, PA 19382 | CDOM: 5 | SP/OP: 100.00% | Sold Price: $584,000
- 2 Rustic Malvern, PA 19355 | CDOM: 5 | SP/OP: 105.00% | Sold Price: $525,000
- 2205 Westfield Newtown Square, PA 19073 | CDOM: 19 | SP/OP: 95.83% | Sold Price: $345,000
- 226 Walnut Tree Malvern, PA 19355 | CDOM: 134 | SP/OP: 143.45% | Sold Price: $2,388,392
- 301 Freedom Newtown Square, PA 19073 | CDOM: 14 | SP/OP: 83.61% | Sold Price: $1,250,000
- 312 Old Kingfisher Malvern, PA 19355 | CDOM: 63 | SP/OP: 121.32% | Sold Price: $2,019,956
- 3207 Stoneham West Chester, PA 19382 | CDOM: 12 | SP/OP: 90.79% | Sold Price: $345,000
- 51 Plank Paoli, PA 19301 | CDOM: 4 | SP/OP: 103.15% | Sold Price: $360,000
- 56 Juliet Lane West Chester, PA 19382 | CDOM: 202 | SP/OP: 100.00% | Sold Price: $749,615
- 801 Weatherstone Paoli, PA 19301 | CDOM: 75 | SP/OP: 111.30% | Sold Price: $640,000
- 847 Providence Malvern, PA 19355 | CDOM: 230 | SP/OP: 80.00% | Sold Price: $6,000,000
- 902 Weatherstone Paoli, PA 19301 | CDOM: 35 | SP/OP: 97.14% | Sold Price: $510,000
Kennett Consolidated School District
Total Sales Volume: $25,724,900
East Marlboro Township (7 Sales):
- 106 Manor Kennett Square, PA 19348 | CDOM: 4 | SP/OP: 112.31% | Sold Price: $730,000
- 200 Cherry Kennett Square, PA 19348 | CDOM: 4 | SP/OP: 115.00% | Sold Price: $575,000
- 258 Deepdale Kennett Square, PA 19348 | CDOM: 4 | SP/OP: 104.24% | Sold Price: $516,000
- 330 Redbud Kennett Square, PA 19348 | CDOM: 40 | SP/OP: 97.85% | Sold Price: $587,000
- 425 Brentford Kennett Square, PA 19348 | CDOM: 4 | SP/OP: 102.86% | Sold Price: $900,000
- 615 Unionville Kennett Square, PA 19348 | CDOM: 6 | SP/OP: 100.98% | Sold Price: $515,000
- 640 N Walnut Kennett Square, PA 19348 | CDOM: 201 | SP/OP: 85.21% | Sold Price: $3,400,000
Kennett Square Borough (5 Sales):
- 312 S Broad Kennett Square, PA 19348 | CDOM: 6 | SP/OP: 93.99% | Sold Price: $860,000
- 410 Southview Kennett Square, PA 19348 | CDOM: 6 | SP/OP: 106.80% | Sold Price: $630,000
- 453 Chestnut Kennett Square, PA 19348 | CDOM: 0 | SP/OP: 100.00% | Sold Price: $300,000
- 501 Magnolia Kennett Square, PA 19348 | CDOM: 5 | SP/OP: 111.36% | Sold Price: $501,000
- 605 W Mulberry Kennett Square, PA 19348 | CDOM: 23 | SP/OP: 98.79% | Sold Price: $572,000
Kennett Township (12 Sales):
- 101 Hart Avondale, PA 19311 | CDOM: 9 | SP/OP: 100.00% | Sold Price: $725,000
- 1024 James Walter Kennett Square, PA 19348 | CDOM: 4 | SP/OP: 97.65% | Sold Price: $810,000
- 103 Ringtail Kennett Square, PA 19348 | CDOM: 3 | SP/OP: 100.00% | Sold Price: $725,000
- 107 Pierce Kennett Square, PA 19348 | CDOM: 4 | SP/OP: 102.00% | Sold Price: $815,000
- 118 Ashford Chadds Ford, PA 19317 | CDOM: 12 | SP/OP: 100.00% | Sold Price: $975,000
- 1919 Hillendale Chadds Ford, PA 19317 | CDOM: 6 | SP/OP: 99.21% | Sold Price: $624,900
- 301 E Branch Kennett Square, PA 19348 | CDOM: 52 | SP/OP: 89.61% | Sold Price: $1,250,000
- 413 Megan Kennett Square, PA 19348 | CDOM: 6 | SP/OP: 101.52% | Sold Price: $335,000
- 421 Megan Kennett Square, PA 19348 | CDOM: 3 | SP/OP: 106.15% | Sold Price: $345,000
- 58 Pointe Place 18 Kennett Square, PA 19348 | CDOM: 126 | SP/OP: 95.86% | Sold Price: $550,000
- 629 Cope Kennett Square, PA 19348 | CDOM: 23 | SP/OP: 86.36% | Sold Price: $475,000
- 701 Kilduff Chadds Ford, PA 19317 | CDOM: 10 | SP/OP: 100.00% | Sold Price: $425,000
New Garden Township (12 Sales):
- 100 Pyles Mountain Avondale, PA 19311 | CDOM: 108 | SP/OP: 82.60% | Sold Price: $1,400,000
- 109 Longo Avondale, PA 19311 | CDOM: 68 | SP/OP: 94.22% | Sold Price: $424,000
- 116 Cambridge Landenberg, PA 19350 | CDOM: 10 | SP/OP: 96.64% | Sold Price: $575,000
- 136 Harrogate Landenberg, PA 19350 | CDOM: 6 | SP/OP: 100.00% | Sold Price: $875,000
- 137 Skyline Landenberg, PA 19350 | CDOM: 7 | SP/OP: 101.82% | Sold Price: $560,000
- 168 Hamilton Landenberg, PA 19350 | CDOM: 6 | SP/OP: 101.63% | Sold Price: $630,000
- 183 Willow Toughkenamon, PA 19374 | CDOM: 2 | SP/OP: 95.77% | Sold Price: $340,000
- 2 Lake Shore Landenberg, PA 19350 | CDOM: 1 | SP/OP: 100.00% | Sold Price: $850,000
- 210 Brittany Avondale, PA 19311 | CDOM: 47 | SP/OP: 88.20% | Sold Price: $485,000
- 605 Hillendale Avondale, PA 19311 | CDOM: 51 | SP/OP: 84.11% | Sold Price: $450,000
- 8 Eagle Avondale, PA 19311 | CDOM: 24 | SP/OP: 85.00% | Sold Price: $595,000
- 907 Newark Toughkenamon, PA 19374 | CDOM: 4 | SP/OP: 114.32% | Sold Price: $400,000
Octorara Area School District
Total Sales Volume: $5,616,735
Atglen Borough (3 Sales):
- 414 Courtland Atglen, PA 19310 | CDOM: 1 | SP/OP: 100.00% | Sold Price: $574,835
- 416 Courtland Atglen, PA 19310 | CDOM: 1 | SP/OP: 100.00% | Sold Price: $561,900
- 674 Glen Run Atglen, PA 19310 | CDOM: 4 | SP/OP: 100.02% | Sold Price: $435,000
Londonderry Township (5 Sales):
- 12 Birchwood Cochranville, PA 19330 | CDOM: 4 | SP/OP: 105.19% | Sold Price: $710,000
- 228 Faggs Manor Cochranville, PA 19330 | CDOM: 5 | SP/OP: 105.88% | Sold Price: $450,000
- 328 Robinson Cochranville, PA 19330 | CDOM: 3 | SP/OP: 100.03% | Sold Price: $400,000
- 439 Laurel Ridge Cochranville, PA 19330 | CDOM: 3 | SP/OP: 100.00% | Sold Price: $379,000
- 707 Towhee Cochranville, PA 19330 | CDOM: 15 | SP/OP: 96.76% | Sold Price: $445,000
Parkesburg Borough (1 Sale):
- 598 5Th Parkesburg, PA 19365 | CDOM: 5 | SP/OP: 100.94% | Sold Price: $333,000
West Fallowfield Township (2 Sales):
- 26 Henley Cochranville, PA 19330 | CDOM: 3 | SP/OP: 115.29% | Sold Price: $490,000
- 6 Rosewood Atglen, PA 19310 | CDOM: 1 | SP/OP: 100.00% | Sold Price: $71,000
West Sadsbury Township (2 Sales):
- 525 Woodland Parkesburg, PA 19365 | CDOM: 29 | SP/OP: 95.00% | Sold Price: $475,000
- 5528 Strasburg Atglen, PA 19310 | CDOM: 45 | SP/OP: 166.86% | Sold Price: $292,000
Owen J Roberts School District
Total Sales Volume: $21,509,943
East Coventry Township (15 Sales):
- 106 Halteman Pottstown, PA 19465 | CDOM: 4 | SP/OP: 105.77% | Sold Price: $550,000
- 1196 Schoolhouse Pottstown, PA 19465 | CDOM: 7 | SP/OP: 101.01% | Sold Price: $500,000
- 2002 E Cedarville Pottstown, PA 19465 | CDOM: 7 | SP/OP: 126.19% | Sold Price: $238,500
- 2359 E Cedarville Pottstown, PA 19465 | CDOM: 144 | SP/OP: 96.52% | Sold Price: $665,900
- 26 Hastings Spring City, PA 19475 | CDOM: 16 | SP/OP: 96.89% | Sold Price: $775,000
- 312 Zieber Spring City, PA 19475 | CDOM: 3 | SP/OP: 115.71% | Sold Price: $405,000
- 35 Sage Pottstown, PA 19465 | CDOM: 33 | SP/OP: 93.89% | Sold Price: $751,000
- 36 Terrace Spring City, PA 19475 | CDOM: 6 | SP/OP: 105.32% | Sold Price: $105,000
- 417 Spiece Pottstown, PA 19465 | CDOM: 140 | SP/OP: 88.82% | Sold Price: $444,000
- 52 Mark Pottstown, PA 19465 | CDOM: 7 | SP/OP: 96.67% | Sold Price: $435,000
- 63 Holly Pottstown, PA 19465 | CDOM: 6 | SP/OP: 104.63% | Sold Price: $680,000
- 81 Painters Pottstown, PA 19465 | CDOM: 7 | SP/OP: 95.25% | Sold Price: $525,770
- 85 Painters Pottstown, PA 19465 | CDOM: 33 | SP/OP: 96.16% | Sold Price: $550,000
- 95 Earl Pottstown, PA 19465 | CDOM: 3 | SP/OP: 108.43% | Sold Price: $450,000
- 97 Linwood Pottstown, PA 19465 | CDOM: 3 | SP/OP: 101.38% | Sold Price: $740,000
East Nantmeal Township (2 Sales):
- 3356 Conestoga Glenmoore, PA 19343 | CDOM: 3 | SP/OP: 103.36% | Sold Price: $465,000
- 514 Bulltown Elverson, PA 19520 | CDOM: 32 | SP/OP: 86.15% | Sold Price: $560,000
East Vincent Township (9 Sales):
- 1 Carrigan Spring City, PA 19475 | CDOM: 20 | SP/OP: 84.53% | Sold Price: $317,000
- 200 Valley Creek Lane Spring City, PA 19475 | CDOM: 41 | SP/OP: 108.51% | Sold Price: $867,973
- 206 Valley Creek Lane Spring City, PA 19475 | CDOM: 121 | SP/OP: 102.35% | Sold Price: $870,000
- 237 Rolling Glen Spring City, PA 19475 | CDOM: 3 | SP/OP: 102.86% | Sold Price: $575,000
- 405 Emerald Spring City, PA 19475 | CDOM: 15 | SP/OP: 98.95% | Sold Price: $930,000
- 409 Winding Stream Spring City, PA 19475 | CDOM: 4 | SP/OP: 102.56% | Sold Price: $551,500
- 601 New Spring City, PA 19475 | CDOM: 3 | SP/OP: 100.00% | Sold Price: $340,000
- 833 Cypress Spring City, PA 19475 | CDOM: 37 | SP/OP: 97.99% | Sold Price: $146,000
- 9 Washington Spring City, PA 19475 | CDOM: 6 | SP/OP: 107.50% | Sold Price: $430,000
North Coventry Township (2 Sales):
- 1125 Laurelwood Pottstown, PA 19465 | CDOM: 4 | SP/OP: 100.00% | Sold Price: $374,900
- 294 Laurelwood Pottstown, PA 19465 | CDOM: 20 | SP/OP: 101.41% | Sold Price: $187,500
Warwick Township (4 Sales):
- 147 Sunrise LOT 25 Pottstown, PA 19465 | CDOM: 19 | SP/OP: 96.84% | Sold Price: $92,000
- 1900 Ridge Pottstown, PA 19465 | CDOM: 8 | SP/OP: 112.00% | Sold Price: $588,000
- 260 Laurel Elverson, PA 19520 | CDOM: 16 | SP/OP: 100.00% | Sold Price: $245,000
- 2950 S Hill Camp Pottstown, PA 19465 | CDOM: 18 | SP/OP: 98.33% | Sold Price: $413,000
West Vincent Township (5 Sales):
- 2430 Horseshoe Chester Springs, PA 19425 | CDOM: 12 | SP/OP: 103.37% | Sold Price: $460,000
- 2441 Malehorn Chester Springs, PA 19425 | CDOM: 5 | SP/OP: 98.28% | Sold Price: $972,900
- 2619 Chester Springs Chester Springs, PA 19425 | CDOM: 40 | SP/OP: 77.63% | Sold Price: $2,325,000
- 4004 Trillium Chester Springs, PA 19425 | CDOM: 11 | SP/OP: 97.48% | Sold Price: $1,199,000
- 6 Fox Run Chester Springs, PA 19425 | CDOM: 74 | SP/OP: 89.71% | Sold Price: $785,000
Oxford Area School District
Total Sales Volume: $9,609,685
East Nottingham Township (11 Sales):
- 1008 Wyoming Lincoln University, PA 19352 | CDOM: 6 | SP/OP: 109.13% | Sold Price: $545,525
- 110 Freiberg Lincoln University, PA 19352 | CDOM: 15 | SP/OP: 102.11% | Sold Price: $557,500
- 113 Ponds View Oxford, PA 19363 | CDOM: 9 | SP/OP: 98.20% | Sold Price: $432,000
- 125 Lincolnshire LOT 109 (LIMERICK) Oxford, PA 19363 | CDOM: 1 | SP/OP: 109.92% | Sold Price: $472,565
- 127 Valleyview Lincoln University, PA 19352 | CDOM: 10 | SP/OP: 96.39% | Sold Price: $480,000
- 140 Granite Oxford, PA 19363 | CDOM: 4 | SP/OP: 106.52% | Sold Price: $425,000
- 165 Duck Farm Oxford, PA 19363 | CDOM: 7 | SP/OP: 101.90% | Sold Price: $535,000
- 429 Highland Oxford, PA 19363 | CDOM: 5 | SP/OP: 101.79% | Sold Price: $427,500
- 460 Little Elk Creek Lincoln University, PA 19352 | CDOM: 5 | SP/OP: 102.81% | Sold Price: $370,000
- 541 Little Elk Creek Oxford, PA 19363 | CDOM: 2 | SP/OP: 99.86% | Sold Price: $649,000
- 568 Little Elk Creek Oxford, PA 19363 | CDOM: 23 | SP/OP: 87.88% | Sold Price: $290,000
Lower Oxford Township (4 Sales):
- 115 Juniper Drive, Lot #97 (Balsam) Oxford, PA 19363 | CDOM: 1372 | SP/OP: 117.84% | Sold Price: $512,495
- 126 Juniper LOT 71 (BALSAM) Oxford, PA 19363 | CDOM: 1 | SP/OP: 111.08% | Sold Price: $483,100
- 249 Flintwood Oxford, PA 19363 | CDOM: 83 | SP/OP: 93.80% | Sold Price: $469,000
- 618 Limestone Oxford, PA 19363 | CDOM: 4 | SP/OP: 107.55% | Sold Price: $285,000
Oxford Borough (3 Sales):
- 454 Broad Oxford, PA 19363 | CDOM: 4 | SP/OP: 100.00% | Sold Price: $300,000
- 630 Broad Oxford, PA 19363 | CDOM: 5 | SP/OP: 100.00% | Sold Price: $299,000
- 741 W Locust Oxford, PA 19363 | CDOM: 8 | SP/OP: 97.32% | Sold Price: $360,000
Upper Oxford Township (2 Sales):
- 10 Webster Oxford, PA 19363 | CDOM: 33 | SP/OP: 100.01% | Sold Price: $700,000
- 111 Fieldcrest Cochranville, PA 19330 | CDOM: 12 | SP/OP: 103.12% | Sold Price: $463,000
- West Nottingham Township (2 Sales):
- 206 Fremont Nottingham, PA 19362 | CDOM: 4 | SP/OP: 100.23% | Sold Price: $430,000
- 207 Sunset Nottingham, PA 19362 | CDOM: 28 | SP/OP: 95.46% | Sold Price: $124,000
Phoenixville Area School District
Total Sales Volume: $21,659,859
East Pikeland Township (6 Sales):
- 111 Dennis Phoenixville, PA 19460 | CDOM: 3 | SP/OP: 102.04% | Sold Price: $750,000
- 2801 Doris Phoenixville, PA 19460 | CDOM: 5 | SP/OP: 104.11% | Sold Price: $380,000
- 32 Galicia Phoenixville, PA 19460 | CDOM: 14 | SP/OP: 98.06% | Sold Price: $505,000
- 37 Jonathan Phoenixville, PA 19460 | CDOM: 7 | SP/OP: 101.02% | Sold Price: $505,000
- 401 Millwright Phoenixville, PA 19460 | CDOM: 85 | SP/OP: 85.71% | Sold Price: $900,000
- 614 Wall Phoenixville, PA 19460 | CDOM: 6 | SP/OP: 102.73% | Sold Price: $380,000
Phoenixville Borough (25 Sales):
- 10 Morgan Phoenixville, PA 19460 | CDOM: 8 | SP/OP: 85.42% | Sold Price: $205,000
- 107 James Phoenixville, PA 19460 | CDOM: 3 | SP/OP: 109.55% | Sold Price: $460,000
- 111 Smithworks Phoenixville, PA 19460 | CDOM: 56 | SP/OP: 100.34% | Sold Price: $595,000
- 1242 Madison Phoenixville, PA 19460 | CDOM: 6 | SP/OP: 105.26% | Sold Price: $500,000
- 126 South Phoenixville, PA 19460 | CDOM: 58 | SP/OP: 96.20% | Sold Price: $380,000
- 130 Gay Phoenixville, PA 19460 | CDOM: 4 | SP/OP: 104.43% | Sold Price: $412,500
- 170 Chester Phoenixville, PA 19460 | CDOM: 4 | SP/OP: 116.00% | Sold Price: $435,000
- 224 1St Phoenixville, PA 19460 | CDOM: 4 | SP/OP: 111.19% | Sold Price: $667,000
- 24 Nutt Phoenixville, PA 19460 | CDOM: 3 | SP/OP: 100.00% | Sold Price: $399,000
- 2505 Overture Phoenixville, PA 19460 | CDOM: 1 | SP/OP: 102.59% | Sold Price: $480,000
- 3003 Canard Phoenixville, PA 19460 | CDOM: 4 | SP/OP: 105.30% | Sold Price: $695,000
- 3213 Ellington Phoenixville, PA 19460 | CDOM: 3 | SP/OP: 101.11% | Sold Price: $455,000
- 323 Buchanan Phoenixville, PA 19460 | CDOM: 36 | SP/OP: 100.00% | Sold Price: $350,000
- 323 Gay Phoenixville, PA 19460 | CDOM: 0 | SP/OP: 100.00% | Sold Price: $797,360
- 357 Walnut Phoenixville, PA 19460 | CDOM: 5 | SP/OP: 95.91% | Sold Price: $211,000
- 398 Washington Phoenixville, PA 19460 | CDOM: 4 | SP/OP: 111.17% | Sold Price: $428,000
- 404 Heckle Phoenixville, PA 19460 | CDOM: 6 | SP/OP: 98.82% | Sold Price: $420,000
- 428 W Anderson Phoenixville, PA 19460 | CDOM: 8 | SP/OP: 101.54% | Sold Price: $330,000
- 458 W High Phoenixville, PA 19460 | CDOM: 5 | SP/OP: 105.08% | Sold Price: $331,000
- 54 Kenalcon Phoenixville, PA 19460 | CDOM: 5 | SP/OP: 105.80% | Sold Price: $529,000
- 606 Needle Phoenixville, PA 19460 | CDOM: 6 | SP/OP: 105.57% | Sold Price: $417,000
- 607 Waitkus Phoenixville, PA 19460 | CDOM: 3 | SP/OP: 103.01% | Sold Price: $482,000
- 609 Needle Phoenixville, PA 19460 | CDOM: 4 | SP/OP: 106.25% | Sold Price: $425,000
- 65 Robarts Phoenixville, PA 19460 | CDOM: 5 | SP/OP: 110.71% | Sold Price: $465,000
- 810 Furnace Phoenixville, PA 19460 | CDOM: 31 | SP/OP: 100.00% | Sold Price: $749,999
Schuylkill Township (11 Sales):
- 101 Powderhorn Phoenixville, PA 19460 | CDOM: 4 | SP/OP: 109.38% | Sold Price: $618,000
- 1330 Melvin Phoenixville, PA 19460 | CDOM: 5 | SP/OP: 107.45% | Sold Price: $505,000
- 14 Rosewood Phoenixville, PA 19460 | CDOM: 3 | SP/OP: 100.07% | Sold Price: $150,000
- 203 Drummers Phoenixville, PA 19460 | CDOM: 5 | SP/OP: 110.90% | Sold Price: $875,000
- 31 N Forge Manor Phoenixville, PA 19460 | CDOM: 1 | SP/OP: 100.00% | Sold Price: $500,000
- 34 Musket Phoenixville, PA 19460 | CDOM: 12 | SP/OP: 97.58% | Sold Price: $805,000
- 426 Greene Phoenixville, PA 19460 | CDOM: 5 | SP/OP: 100.70% | Sold Price: $720,000
- 5 S Spring Phoenixville, PA 19460 | CDOM: 8 | SP/OP: 94.81% | Sold Price: $530,000
- 55 Dorchester Phoenixville, PA 19460 | CDOM: 5 | SP/OP: 106.83% | Sold Price: $939,000
- 81 S Forge Manor Phoenixville, PA 19460 | CDOM: 6 | SP/OP: 100.79% | Sold Price: $634,000
- 905 Wells Phoenixville, PA 19460 | CDOM: 17 | SP/OP: 102.99% | Sold Price: $345,000
Spring Ford Area School District
Total Sales Volume: $3,442,237
Spring City Borough (9 Sales):
- 103 S Church Spring City, PA 19475 | CDOM: 4 | SP/OP: 103.68% | Sold Price: $425,000
- 152 Chestnut Spring City, PA 19475 | CDOM: 113 | SP/OP: 86.70% | Sold Price: $303,000
- 216 S S And K Spring City, PA 19475 | CDOM: 7 | SP/OP: 100.00% | Sold Price: $275,000
- 233 Yost Spring City, PA 19475 | CDOM: 4 | SP/OP: 111.60% | Sold Price: $357,000
- 326 Pikeland Spring City, PA 19475 | CDOM: 4 | SP/OP: 110.65% | Sold Price: $265,000
- 411 Queen Spring City, PA 19475 | CDOM: 3 | SP/OP: 121.26% | Sold Price: $478,987
- 414 R Walnut Spring City, PA 19475 | CDOM: 4 | SP/OP: 102.96% | Sold Price: $360,250
- 433 S Main Spring City, PA 19475 | CDOM: 4 | SP/OP: 111.38% | Sold Price: $323,000
- 544 Heckel Spring City, PA 19475 | CDOM: 9 | SP/OP: 104.80% | Sold Price: $655,000
Tredyffrin-Easttown School District
Total Sales Volume: $55,907,791
Easttown Township (14 Sales):
- 1030 Tenby Berwyn, PA 19312 | CDOM: 2 | SP/OP: 126.25% | Sold Price: $1,635,000
- 1140 Waterloo Berwyn, PA 19312 | CDOM: 7 | SP/OP: 93.31% | Sold Price: $1,395,000
- 123 Bartholomew Berwyn, PA 19312 | CDOM: 3 | SP/OP: 116.30% | Sold Price: $785,000
- 2024 Saint Andrews Berwyn, PA 19312 | CDOM: 5 | SP/OP: 106.67% | Sold Price: $1,600,000
- 217 Dorset Devon, PA 19333 | CDOM: 4 | SP/OP: 106.30% | Sold Price: $675,000
- 336 Chester Devon, PA 19333 | CDOM: 19 | SP/OP: 94.99% | Sold Price: $1,800,000
- 337 Lindsey Berwyn, PA 19312 | CDOM: 6 | SP/OP: 95.61% | Sold Price: $1,525,000
- 342 Sugartown Devon, PA 19333 | CDOM: 2 | SP/OP: 111.19% | Sold Price: $1,500,000
- 362 Pond View Devon, PA 19333 | CDOM: 10 | SP/OP: 104.39% | Sold Price: $1,450,000
- 401 Chandlee Berwyn, PA 19312 | CDOM: 190 | SP/OP: 96.00% | Sold Price: $648,000
- 420 Berwyn Baptist Berwyn, PA 19312 | CDOM: 5 | SP/OP: 108.11% | Sold Price: $1,026,000
- 557 Foxwood Paoli, PA 19301 | CDOM: 3 | SP/OP: 104.02% | Sold Price: $520,000
- 900 Prescott LOT 07 Berwyn, PA 19312 | CDOM: 829 | SP/OP: 143.94% | Sold Price: $2,928,954
- Rhydlyn Estate @ 305 Hamlet Circle Berwyn, PA 19312 | CDOM: 41 | SP/OP: 96.06% | Sold Price: $1,512,999
Tredyffrin Township (44 Sales):
- 101 Curtis Chesterbrook, PA 19087 | CDOM: 13 | SP/OP: 100.00% | Sold Price: $515,000
- 1016 Old Lancaster Berwyn, PA 19312 | CDOM: 6 | SP/OP: 107.21% | Sold Price: $707,600
- 104 Camsten Chesterbrook, PA 19087 | CDOM: 3 | SP/OP: 103.27% | Sold Price: $506,000
- 110 Paoli Pointe 110M Paoli, PA 19301 | CDOM: 6 | SP/OP: 101.52% | Sold Price: $335,000
- 110 Quail Wayne, PA 19087 | CDOM: 7 | SP/OP: 103.63% | Sold Price: $1,000,000
- 1105 Parson Curry Malvern, PA 19355 | CDOM: 36 | SP/OP: 82.50% | Sold Price: $1,650,000
- 1161 Rossiter Wayne, PA 19087 | CDOM: 4 | SP/OP: 104.86% | Sold Price: $1,100,000
- 118 Valley Stream Chesterbrook, PA 19087 | CDOM: 4 | SP/OP: 114.92% | Sold Price: $366,600
- 1324 Karen Wayne, PA 19087 | CDOM: 4 | SP/OP: 113.54% | Sold Price: $1,107,000
- 1390 Horseshoe Malvern, PA 19355 | CDOM: 36 | SP/OP: 93.63% | Sold Price: $1,006,500
- 1501 High Grove Malvern, PA 19355 | CDOM: 5 | SP/OP: 110.22% | Sold Price: $2,860,208
- 1635 Thomas Wayne, PA 19087 | CDOM: 6 | SP/OP: 123.39% | Sold Price: $1,203,050
- 164 Kaila Chesterbrook, PA 19087 | CDOM: 4 | SP/OP: 108.00% | Sold Price: $891,000
- 17 Martins Berwyn, PA 19312 | CDOM: 5 | SP/OP: 126.04% | Sold Price: $876,000
- 18 Keystone Paoli, PA 19301 | CDOM: 33 | SP/OP: 92.32% | Sold Price: $550,000
- 1954 Rochambeau Malvern, PA 19355 | CDOM: 9 | SP/OP: 100.00% | Sold Price: $1,289,000
- 2000 Well Springs Malvern, PA 19355 | CDOM: 7 | SP/OP: 103.03% | Sold Price: $1,700,000
- 217 Paoli Pointe Paoli, PA 19301 | CDOM: 4 | SP/OP: 111.46% | Sold Price: $390,000
- 243 Yale Wayne, PA 19087 | CDOM: 3 | SP/OP: 105.26% | Sold Price: $1,000,000
- 274 Vincent Paoli, PA 19301 | CDOM: 4 | SP/OP: 112.61% | Sold Price: $866,000
- 28 Robins Berwyn, PA 19312 | CDOM: 6 | SP/OP: 109.11% | Sold Price: $850,000
- 3 Lakeview Berwyn, PA 19312 | CDOM: 5 | SP/OP: 102.36% | Sold Price: $655,000
- 323 Old Forge Crossing Devon, PA 19333 | CDOM: 2 | SP/OP: 104.04% | Sold Price: $260,000
- 335 Old Forge Crossing Devon, PA 19333 | CDOM: 2 | SP/OP: 112.24% | Sold Price: $275,000
- 34 Keystone Paoli, PA 19301 | CDOM: 42 | SP/OP: 90.03% | Sold Price: $315,000
- 342 Friendship Paoli, PA 19301 | CDOM: 4 | SP/OP: 115.88% | Sold Price: $810,000
- 343 Mcmull Wayne, PA 19087 | CDOM: 3 | SP/OP: 117.08% | Sold Price: $761,000
- 349 Old Forge Crossing 349 Devon, PA 19333 | CDOM: 3 | SP/OP: 111.43% | Sold Price: $273,000
- 375 Old Forge Crossing Devon, PA 19333 | CDOM: 8 | SP/OP: 100.00% | Sold Price: $265,000
- 38 Old Lancaster Devon, PA 19333 | CDOM: 11 | SP/OP: 100.00% | Sold Price: $499,500
- 414 W Valley Wayne, PA 19087 | CDOM: 7 | SP/OP: 102.17% | Sold Price: $613,000
- 55 Abrams Chesterbrook, PA 19087 | CDOM: 3 | SP/OP: 107.64% | Sold Price: $451,000
- 573 W Valley Wayne, PA 19087 | CDOM: 6 | SP/OP: 107.62% | Sold Price: $1,022,380
- 617 Hickory Berwyn, PA 19312 | CDOM: 15 | SP/OP: 102.52% | Sold Price: $815,000
- 64 Main Chesterbrook, PA 19087 | CDOM: 4 | SP/OP: 101.84% | Sold Price: $610,000
- 660 Twin Bridge Wayne, PA 19087 | CDOM: 8 | SP/OP: 98.32% | Sold Price: $880,000
- 705 Turnbridge Wayne, PA 19087 | CDOM: 5 | SP/OP: 125.64% | Sold Price: $2,450,000
- 78 Oak Knoll Drive Berwyn, PA 19312 | CDOM: 6 | SP/OP: 98.22% | Sold Price: $442,000
- 83 Andover Chesterbrook, PA 19087 | CDOM: 12 | SP/OP: 100.95% | Sold Price: $585,000
- 86 Highpoint Berwyn, PA 19312 | CDOM: 10 | SP/OP: 96.72% | Sold Price: $590,000
- 88 Andover Chesterbrook, PA 19087 | CDOM: 6 | SP/OP: 107.55% | Sold Price: $591,000
- 938 Ivycroft Wayne, PA 19087 | CDOM: 4 | SP/OP: 115.87% | Sold Price: $1,825,000
- 940 Stuart Berwyn, PA 19312 | CDOM: 3 | SP/OP: 109.52% | Sold Price: $1,150,000
Twin Valley School District
Total Sales Volume: $7,673,908
Elverson Borough (5 Sales):
- 113 N Yeingst Dr Elverson, PA 19520 | CDOM: 4 | SP/OP: 103.12% | Sold Price: $334,000
- 115 S Chestnut Elverson, PA 19520 | CDOM: 3 | SP/OP: 105.35% | Sold Price: $315,000
- 127 N Yeingst Elverson, PA 19520 | CDOM: 3 | SP/OP: 106.84% | Sold Price: $304,500
- 231 S Pine Elverson, PA 19520 | CDOM: 12 | SP/OP: 98.00% | Sold Price: $440,000
- 3 Churchill Elverson, PA 19520 | CDOM: 12 | SP/OP: 96.94% | Sold Price: $475,000
Honeybrook Borough (1 Sale):
- 4431 Horseshoe Honey Brook, PA 19344 | CDOM: 12 | SP/OP: 98.57% | Sold Price: $345,000
Honeybrook Township (10 Sales):
- 103 Petrelia Honey Brook, PA 19344 | CDOM: 9 | SP/OP: 102.52% | Sold Price: $533,000
- 139 Petrelia Honey Brook, PA 19344 | CDOM: 2 | SP/OP: 105.78% | Sold Price: $565,497
- 225 Chastain Honey Brook, PA 19344 | CDOM: 1 | SP/OP: 100.00% | Sold Price: $639,070
- 232 Cog Hill Honey Brook, PA 19344 | CDOM: 6 | SP/OP: 102.45% | Sold Price: $460,000
- 305 Glasgow Honey Brook, PA 19344 | CDOM: 1 | SP/OP: 100.00% | Sold Price: $576,100
- 333 Grandview Honey Brook, PA 19344 | CDOM: 4 | SP/OP: 107.79% | Sold Price: $415,000
- 41 Archery Honey Brook, PA 19344 | CDOM: 36 | SP/OP: 104.55% | Sold Price: $115,000
- 510 Sativa Honey Brook, PA 19344 | CDOM: 1 | SP/OP: 100.00% | Sold Price: $695,015
- 530 Meadow Honey Brook, PA 19344 | CDOM: 6 | SP/OP: 104.32% | Sold Price: $365,000
- 88 Mount Pleasant Honey Brook, PA 19344 | CDOM: 59 | SP/OP: 96.97% | Sold Price: $480,000
West Nantmeal Township (1 Sale):
- 146 Stetson Elverson, PA 19520 | CDOM: 5 | SP/OP: 103.65% | Sold Price: $616,726
Unionville-Chadds Ford School District
Total Sales Volume: $13,370,580
Birmingham Township (6 Sales):
- 1082 Heartsease West Chester, PA 19382 | CDOM: 3 | SP/OP: 103.43% | Sold Price: $905,000
- 1106 Sherbrooke West Chester, PA 19382 | CDOM: 4 | SP/OP: 109.80% | Sold Price: $1,032,000
- 451 Crescent West Chester, PA 19382 | CDOM: 55 | SP/OP: 88.89% | Sold Price: $600,000
- 686 Farmstead West Chester, PA 19382 | CDOM: 5 | SP/OP: 120.00% | Sold Price: $1,260,000
- 848 Pheasant Run West Chester, PA 19382 | CDOM: 3 | SP/OP: 106.47% | Sold Price: $905,000
- 906 General Howe West Chester, PA 19382 | CDOM: 5 | SP/OP: 102.29% | Sold Price: $715,000
Newlin Township (1 Sale):
- 1054 Wawaset Kennett Square, PA 19348 | CDOM: 18 | SP/OP: 80.89% | Sold Price: $525,000
Pennsbury Township (5 Sales):
- 101 Hickory Hill Chadds Ford, PA 19317 | CDOM: 113 | SP/OP: 92.11% | Sold Price: $1,750,000
- 12 Washington Chadds Ford, PA 19317 | CDOM: 7 | SP/OP: 98.49% | Sold Price: $645,000
- 205 E Village Chadds Ford, PA 19317 | CDOM: 5 | SP/OP: 97.26% | Sold Price: $432,825
- 30 Sapling Kennett Square, PA 19348 | CDOM: 2 | SP/OP: 102.35% | Sold Price: $870,000
- 701 Fairville Chadds Ford, PA 19317 | CDOM: 76 | SP/OP: 64.58% | Sold Price: $775,000
Pocopson Township (4 Sales):
- 12 Maentel West Chester, PA 19382 | CDOM: 30 | SP/OP: 92.40% | Sold Price: $1,190,000
- 120 Pratt West Chester, PA 19382 | CDOM: 6 | SP/OP: 100.00% | Sold Price: $980,000
- 1378 Bridge West Chester, PA 19382 | CDOM: 80 | SP/OP: 74.53% | Sold Price: $242,220
- 7 Tullamore West Chester, PA 19382 | CDOM: 45 | SP/OP: 84.93% | Sold Price: $543,535
West Chester Area School District
Total Sales Volume: $86,028,140
East Bradford Township (11 Sales):
- 1175 Harmony Hill Downingtown, PA 19335 | CDOM: 45 | SP/OP: 60.71% | Sold Price: $850,000
- 309 Gaffney West Chester, PA 19382 | CDOM: 87 | SP/OP: 92.12% | Sold Price: $889,000
- 403 Sunney Brook West Chester, PA 19382 | CDOM: 1 | SP/OP: 100.00% | Sold Price: $900,000
- 705 W Market West Chester, PA 19382 | CDOM: 10 | SP/OP: 96.23% | Sold Price: $1,150,000
- 709 Clover Ridge West Chester, PA 19380 | CDOM: 3 | SP/OP: 106.38% | Sold Price: $850,000
- 730 Mccardle West Chester, PA 19380 | CDOM: 26 | SP/OP: 97.00% | Sold Price: $485,000
- 771 Scotch West Chester, PA 19382 | CDOM: 5 | SP/OP: 104.63% | Sold Price: $520,000
- 813 Happy Creek West Chester, PA 19380 | CDOM: 4 | SP/OP: 98.60% | Sold Price: $562,000
- 820 Brettingham 908 West Chester, PA 19382 | CDOM: 4 | SP/OP: 102.22% | Sold Price: $460,000
- 913 Briar Wood West Chester, PA 19380 | CDOM: 10 | SP/OP: 95.38% | Sold Price: $620,000
- 936 W Miner West Chester, PA 19382 | CDOM: 118 | SP/OP: 91.72% | Sold Price: $802,500
East Goshen Township (22 Sales):
- 1217 Culbertson West Chester, PA 19380 | CDOM: 2 | SP/OP: 107.73% | Sold Price: $850,000
- 1249 Oakmont West Chester, PA 19380 | CDOM: 5 | SP/OP: 99.13% | Sold Price: $570,000
- 13 Brookmont Malvern, PA 19355 | CDOM: 6 | SP/OP: 100.00% | Sold Price: $819,900
- 1323 Robynwood West Chester, PA 19380 | CDOM: 2 | SP/OP: 107.44% | Sold Price: $752,000
- 1409 Manley West Chester, PA 19382 | CDOM: 3 | SP/OP: 106.12% | Sold Price: $451,004
- 1420 Linden West Chester, PA 19380 | CDOM: 1 | SP/OP: 100.00% | Sold Price: $710,000
- 1479 Quaker West Chester, PA 19380 | CDOM: 5 | SP/OP: 110.00% | Sold Price: $770,000
- 172 Chandler West Chester, PA 19380 | CDOM: 4 | SP/OP: 98.87% | Sold Price: $370,750
- 250 Chatham West Chester, PA 19380 | CDOM: 42 | SP/OP: 93.64% | Sold Price: $515,000
- 287 Devon West Chester, PA 19380 | CDOM: 4 | SP/OP: 100.00% | Sold Price: $385,000
- 296 Devon West Chester, PA 19380 | CDOM: 5 | SP/OP: 110.84% | Sold Price: $460,000
- 316 Summit House West Chester, PA 19382 | CDOM: 7 | SP/OP: 102.98% | Sold Price: $242,000
- 357 Devon West Chester, PA 19380 | CDOM: 2 | SP/OP: 104.00% | Sold Price: $390,000
- 389 Eaton West Chester, PA 19380 | CDOM: 11 | SP/OP: 103.70% | Sold Price: $700,000
- 512 Everest West Chester, PA 19382 | CDOM: 8 | SP/OP: 100.00% | Sold Price: $300,000
- 620 Summit House West Chester, PA 19382 | CDOM: 9 | SP/OP: 102.50% | Sold Price: $205,000
- 625 Summit House West Chester, PA 19382 | CDOM: 9 | SP/OP: 100.00% | Sold Price: $260,000
- 644 Summit House West Chester, PA 19382 | CDOM: 5 | SP/OP: 95.28% | Sold Price: $200,000
- 763 Inverness West Chester, PA 19380 | CDOM: 5 | SP/OP: 97.62% | Sold Price: $512,500
- 926 Monte Vista West Chester, PA 19380 | CDOM: 5 | SP/OP: 101.48% | Sold Price: $685,000
- 942 Forest Lane Malvern, PA 19355 | CDOM: 198 | SP/OP: 133.86% | Sold Price: $2,362,554
- 947 Cornwallis West Chester, PA 19380 | CDOM: 18 | SP/OP: 110.40% | Sold Price: $1,380,000
Thornbury Township (2 Sales):
- 112 Leadline West Chester, PA 19382 | CDOM: 8 | SP/OP: 103.30% | Sold Price: $815,000
- 1387 College Hill Cheyney, PA 19319 | CDOM: 40 | SP/OP: 88.42% | Sold Price: $839,900
West Chester Borough (10 Sales):
- 125 S Worthington West Chester, PA 19382 | CDOM: 3 | SP/OP: 117.06% | Sold Price: $350,000
- 210 W Union West Chester, PA 19382 | CDOM: 6 | SP/OP: 94.69% | Sold Price: $535,000
- 229 Wollerton West Chester, PA 19382 | CDOM: 1 | SP/OP: 100.00% | Sold Price: $450,000
- 327 Hannum West Chester, PA 19380 | CDOM: 5 | SP/OP: 115.19% | Sold Price: $455,000
- 341 W Barnard West Chester, PA 19382 | CDOM: 1 | SP/OP: 105.88% | Sold Price: $900,000
- 429 N New West Chester, PA 19380 | CDOM: 1 | SP/OP: 100.00% | Sold Price: $593,000
- 501 Raymond West Chester, PA 19380 | CDOM: 5 | SP/OP: 109.17% | Sold Price: $655,000
- 503 W Biddle West Chester, PA 19380 | CDOM: 3 | SP/OP: 121.18% | Sold Price: $515,000
- 507 William Ebbs 3C West Chester, PA 19380 | CDOM: 5 | SP/OP: 106.50% | Sold Price: $669,900
- 513 W Marshall West Chester, PA 19380 | CDOM: 5 | SP/OP: 94.12% | Sold Price: $560,000
West Goshen Township (37 Sales):
- 1016 Faustina West Chester, PA 19382 | CDOM: 6 | SP/OP: 107.45% | Sold Price: $591,000
- 1113 Cotswold West Chester, PA 19380 | CDOM: 2 | SP/OP: 113.47% | Sold Price: $851,000
- 118 Adrienne West Chester, PA 19380 | CDOM: 5 | SP/OP: 102.81% | Sold Price: $1,181,560
- 120 Adrienne West Chester, PA 19380 | CDOM: 5 | SP/OP: 105.05% | Sold Price: $1,382,650
- 1230 Paoli West Chester, PA 19380 | CDOM: 4 | SP/OP: 102.52% | Sold Price: $610,000
- 1242 Hamilton West Chester, PA 19380 | CDOM: 3 | SP/OP: 107.71% | Sold Price: $915,500
- 128 Adrienne West Chester, PA 19380 | CDOM: 72 | SP/OP: 100.65% | Sold Price: $1,365,145
- 1304 Burke West Chester, PA 19380 | CDOM: 3 | SP/OP: 101.82% | Sold Price: $560,000
- 1326 Mary Jane West Chester, PA 19380 | CDOM: 3 | SP/OP: 106.08% | Sold Price: $551,500
- 1334 Chiswick West Chester, PA 19380 | CDOM: 2 | SP/OP: 108.24% | Sold Price: $801,000
- 141 Adrienne West Chester, PA 19380 | CDOM: 2 | SP/OP: 98.07% | Sold Price: $1,378,160
- 1504 Sorber West Chester, PA 19380 | CDOM: 4 | SP/OP: 105.35% | Sold Price: $985,000
- 1756 Frost West Chester, PA 19380 | CDOM: 36 | SP/OP: 95.08% | Sold Price: $806,795
- 1758 Frost West Chester, PA 19380 | CDOM: 1 | SP/OP: 100.20% | Sold Price: $878,920
- 1760 Frost West Chester, PA 19380 | CDOM: 3 | SP/OP: 100.38% | Sold Price: $862,047
- 1762 Frost West Chester, PA 19380 | CDOM: 2 | SP/OP: 100.12% | Sold Price: $849,565
- 207 Alexis West Chester, PA 19380 | CDOM: 72 | SP/OP: 101.66% | Sold Price: $1,334,220
- 228 Weatherhill West Chester, PA 19382 | CDOM: 4 | SP/OP: 109.24% | Sold Price: $1,300,000
- 24 Gershwin West Chester, PA 19380 | CDOM: 1 | SP/OP: 100.00% | Sold Price: $2,147,965
- 419 Glen West Chester, PA 19382 | CDOM: 26 | SP/OP: 91.65% | Sold Price: $549,000
- 419 Sunset Hollow West Chester, PA 19380 | CDOM: 10 | SP/OP: 105.95% | Sold Price: $980,000
- 501 Seeger West Chester, PA 19380 | CDOM: 6 | SP/OP: 106.38% | Sold Price: $1,250,000
- 502 Summit House West Chester, PA 19382 | CDOM: 3 | SP/OP: 98.70% | Sold Price: $227,000
- 509 Cork West Chester, PA 19380 | CDOM: 5 | SP/OP: 103.23% | Sold Price: $511,000
- 546 Fernhill West Chester, PA 19380 | CDOM: 2 | SP/OP: 107.53% | Sold Price: $430,000
- 711 Wilson West Chester, PA 19382 | CDOM: 7 | SP/OP: 98.65% | Sold Price: $730,000
- 8 Rose West Chester, PA 19380 | CDOM: 1 | SP/OP: 100.00% | Sold Price: $320,000
- 808 Steward West Chester, PA 19382 | CDOM: 15 | SP/OP: 97.46% | Sold Price: $575,000
- 815 Carlson West Chester, PA 19382 | CDOM: 44 | SP/OP: 81.16% | Sold Price: $633,000
- 821 Daisy West Chester, PA 19382 | CDOM: 4 | SP/OP: 109.23% | Sold Price: $710,000
- 848 Partridge West Chester, PA 19382 | CDOM: 3 | SP/OP: 103.36% | Sold Price: $615,000
- 928 Garlington West Chester, PA 19380 | CDOM: 25 | SP/OP: 96.77% | Sold Price: $750,000
- 952 Eakins West Chester, PA 19380 | CDOM: 4 | SP/OP: 101.08% | Sold Price: $1,216,310
- 966 Eakins West Chester, PA 19380 | CDOM: 2 | SP/OP: 110.32% | Sold Price: $1,040,325
- 972 Eakins West Chester, PA 19380 | CDOM: 3 | SP/OP: 100.82% | Sold Price: $1,234,860
- 978 Eakins West Chester, PA 19380 | CDOM: 1 | SP/OP: 100.00% | Sold Price: $1,144,345
- 984 Eakins West Chester, PA 19380 | CDOM: 1 | SP/OP: 100.78% | Sold Price: $1,189,120
West Whiteland Township (29 Sales):
- 121 Fringetree West Chester, PA 19380 | CDOM: 10 | SP/OP: 100.00% | Sold Price: $550,000
- 1293 Kirkland West Chester, PA 19380 | CDOM: 5 | SP/OP: 98.45% | Sold Price: $570,000
- 1302 Greentree West Chester, PA 19380 | CDOM: 5 | SP/OP: 101.00% | Sold Price: $505,000
- 1312 Greentree West Chester, PA 19380 | CDOM: 2 | SP/OP: 110.00% | Sold Price: $577,500
- 1327 Dunsinane West Chester, PA 19380 | CDOM: 1 | SP/OP: 100.00% | Sold Price: $400,000
- 133 Whiteland Hills Exton, PA 19341 | CDOM: 25 | SP/OP: 96.91% | Sold Price: $599,900
- 1387 Station West Chester, PA 19380 | CDOM: 7 | SP/OP: 100.00% | Sold Price: $625,000
- 1464 Grove West Chester, PA 19380 | CDOM: 4 | SP/OP: 105.60% | Sold Price: $660,000
- 201 River Birch Exton, PA 19341 | CDOM: 1 | SP/OP: 100.00% | Sold Price: $565,000
- 203 River Birch Exton, PA 19341 | CDOM: 1 | SP/OP: 100.00% | Sold Price: $554,975
- 205 N Pullman West Chester, PA 19380 | CDOM: 23 | SP/OP: 102.13% | Sold Price: $479,000
- 207 River Birch Exton, PA 19341 | CDOM: 1 | SP/OP: 100.00% | Sold Price: $555,000
- 208 River Birch Exton, PA 19341 | CDOM: 1 | SP/OP: 100.00% | Sold Price: $528,000
- 209 River Birch Exton, PA 19341 | CDOM: 1 | SP/OP: 100.00% | Sold Price: $553,000
- 210 River Birch Exton, PA 19341 | CDOM: 1 | SP/OP: 100.00% | Sold Price: $517,785
- 212 River Birch Exton, PA 19341 | CDOM: 1 | SP/OP: 100.00% | Sold Price: $524,985
- 220 Snowberry West Chester, PA 19380 | CDOM: 15 | SP/OP: 106.68% | Sold Price: $800,000
- 246 Smallwood West Chester, PA 19380 | CDOM: 18 | SP/OP: 107.69% | Sold Price: $350,000
- 264 Torrey Pine West Chester, PA 19380 | CDOM: 4 | SP/OP: 100.00% | Sold Price: $695,000
- 274 Watch Hill Exton, PA 19341 | CDOM: 4 | SP/OP: 106.38% | Sold Price: $867,000
- 301 Fox Exton, PA 19341 | CDOM: 3 | SP/OP: 104.62% | Sold Price: $455,000
- 318 Shoen Exton, PA 19341 | CDOM: 13 | SP/OP: 95.93% | Sold Price: $565,000
- 435 Lee Exton, PA 19341 | CDOM: 4 | SP/OP: 104.41% | Sold Price: $757,000
- 471 Cassatt West Chester, PA 19380 | CDOM: 4 | SP/OP: 113.87% | Sold Price: $427,000
- 5 Corwen Ter W West Chester, PA 19380 | CDOM: 5 | SP/OP: 103.08% | Sold Price: $535,000
- 503 Anthonys Exton, PA 19341 | CDOM: 3 | SP/OP: 107.04% | Sold Price: $1,065,000
- 736 Chessie West Chester, PA 19380 | CDOM: 3 | SP/OP: 107.85% | Sold Price: $426,000
- 812 Reading 7 West Chester, PA 19380 | CDOM: 4 | SP/OP: 101.41% | Sold Price: $431,000
- 898 Railway 55 West Chester, PA 19380 | CDOM: 2 | SP/OP: 109.72% | Sold Price: $350,000
Westtown Township (10 Sales):
- 10 Sawmill LOT 3 West Chester, PA 19382 | CDOM: 128 | SP/OP: 92.13% | Sold Price: $800,500
- 1005 Shady Grove West Chester, PA 19382 | CDOM: 1 | SP/OP: 116.00% | Sold Price: $725,000
- 1019 S Concord West Chester, PA 19382 | CDOM: 12 | SP/OP: 100.00% | Sold Price: $775,000
- 1062 Edgewood Glen Mills, PA 19342 | CDOM: 4 | SP/OP: 107.17% | Sold Price: $777,000
- 1510 Johnnys West Chester, PA 19382 | CDOM: 1 | SP/OP: 84.62% | Sold Price: $550,000
- 1642 E Street Glen Mills, PA 19342 | CDOM: 5 | SP/OP: 110.00% | Sold Price: $577,500
- 305 Ponds Edge West Chester, PA 19382 | CDOM: 20 | SP/OP: 97.71% | Sold Price: $850,000
- 514 Coventry West Chester, PA 19382 | CDOM: 5 | SP/OP: 108.47% | Sold Price: $461,000
- 523 Coventry West Chester, PA 19382 | CDOM: 2 | SP/OP: 105.88% | Sold Price: $450,000
- 817 Kimberly West Chester, PA 19382 | CDOM: 0 | SP/OP: 100.00% | Sold Price: $800,000
If you like what you see...
✅ Sign up for our Newsletter to stay updated on next month’s market trends!
✅ Explore other July 2025 Market Reports:
In summary, the Chester County residential real estate market in July 2025 demonstrated continued strength with rising average prices, even as sales volume and the sale price-to-original price ratio saw a slight decline from the previous month. The market remains dynamic and competitive, underscoring the ongoing importance of strategic pricing and a deep understanding of local trends.
Please feel free to reach out if you have any questions or would like a more detailed analysis of specific areas.
*All information in this report has been collected from Bright MLS and is deemed reliable but not guaranteed. The Broker makes no representations or warranties, express or implied, regarding the accuracy, completeness, or reliability of the data provided. This information is subject to errors, omissions, and data entry inaccuracies, including but not limited to those from cooperating brokers participating in Bright MLS. Additionally, this report does not account for off-market transactions, private sales, or transactions conducted outside of Bright MLS.
This report is for informational purposes only and should not be construed as real estate advice. Individual circumstances vary, and real estate decisions should be based on professional guidance tailored to your specific situation. Please contact Trago Realty or your real estate agent to discuss your particular situation and/or needs.