May 28, 2025
April 2025 Chester County, PA Residential Real Estate Market Update
Welcome to the April 2025 Chester County Real Estate Market Update! This month's report provides a comprehensive overview of the county's active housing market. We're continuing to see a strong sellers' market with homes selling quickly, maintaining a median of just six days on the market, indicating sustained buyer demand. While overall average and median sale prices saw a slight adjustment from March, homes are still frequently selling above their original asking price, highlighting competitive conditions. Strategic pricing remains crucial, as evidenced by an increase in properties undergoing price reductions. This report dives into key metrics, including average and median sale prices, days on market, and financing trends, offering valuable insights for anyone looking to navigate the dynamic Chester County real estate scene. Explore the details below to understand the current market dynamics and how they might impact your real estate goals. To understand how these trends impact your personal real estate goals, call Trago Realty today for a personalized consultation.
Market Insights
April 2025 Chester County Real Estate Market Report: Key Data Points
Here's a straightforward look at the Chester County Residential Real Estate Market activity for April 2025, based on the latest data:
Key Market Metrics:
- Current Price Average: $812,926
- Current Price Median: $609,900
- Months Supply of Inventory: 3 months
- Sale Price-to-Original Price Ratio: 101.80%
- Days to Sell Average: 22 days
- Days to Sell Median: 6 days
- Cumulative Days on Market Average: 25 days
- Cumulative Days on Market Median: 6 days
- Number of Price Reductions: 227
- Reduced Price-to-Original Ask Ratio Average: 93.04%
- Reduced Price-to-Original Ask Ratio Median: 95.00%
- Number of Closed Sales: 507
Mortgage & Payment Types (April 2025):
- Conventional: 63.44%
- Cash: 28.46%
- FHA: 3.75%
- VA: 1.58%
- Other: 1.38%
- Cash, Conventional: 0.59%
- Conventional, PHFA: 0.40%
- PHFA: 0.20%
- USDA: 0.20%
Comparison to March 2025: Key Observations
The Chester County residential real estate market in April 2025 showed notable shifts compared to March 2025:
- Pricing: Both the average ($812,926 in April vs. $833,078 in March) and median ($609,900 in April vs. $625,000 in March) sale prices experienced a slight decrease from March to April. Despite this, homes are still selling above their original list price, with the Sale Price-to-Original Price Ratio increasing to 101.80% in April from 100.75% in March, indicating stronger buyer competition once a property is listed.
- Inventory & Speed: The supply of available homes remained stable at 3 months, indicating continued limited inventory. Homes continued to sell remarkably fast, with the median Days to Sell holding steady at 6 days, and the average days to sell decreasing from 24 days in March to 22 days in April.
- Sales Volume: Perhaps the most significant change is the substantial increase in the number of closed sales, jumping from 369 in March to 507 in April, reflecting a significant surge in market activity.
- Price Reductions: The number of price reductions increased to 227 in April from 150 in March. While the average and median reduced price-to-original ask ratios saw minor adjustments, this suggests that more sellers are recalibrating their pricing strategies to meet the market.
- Financing Trends: Conventional loans continue to dominate (63.44% in April vs. 65.04% in March), with Cash remaining a strong second (28.46% in April, stable from March). We observed a notable increase in FHA loans (3.75% in April vs. 2.44% in March), indicating a broader range of financing options being utilized by buyers.
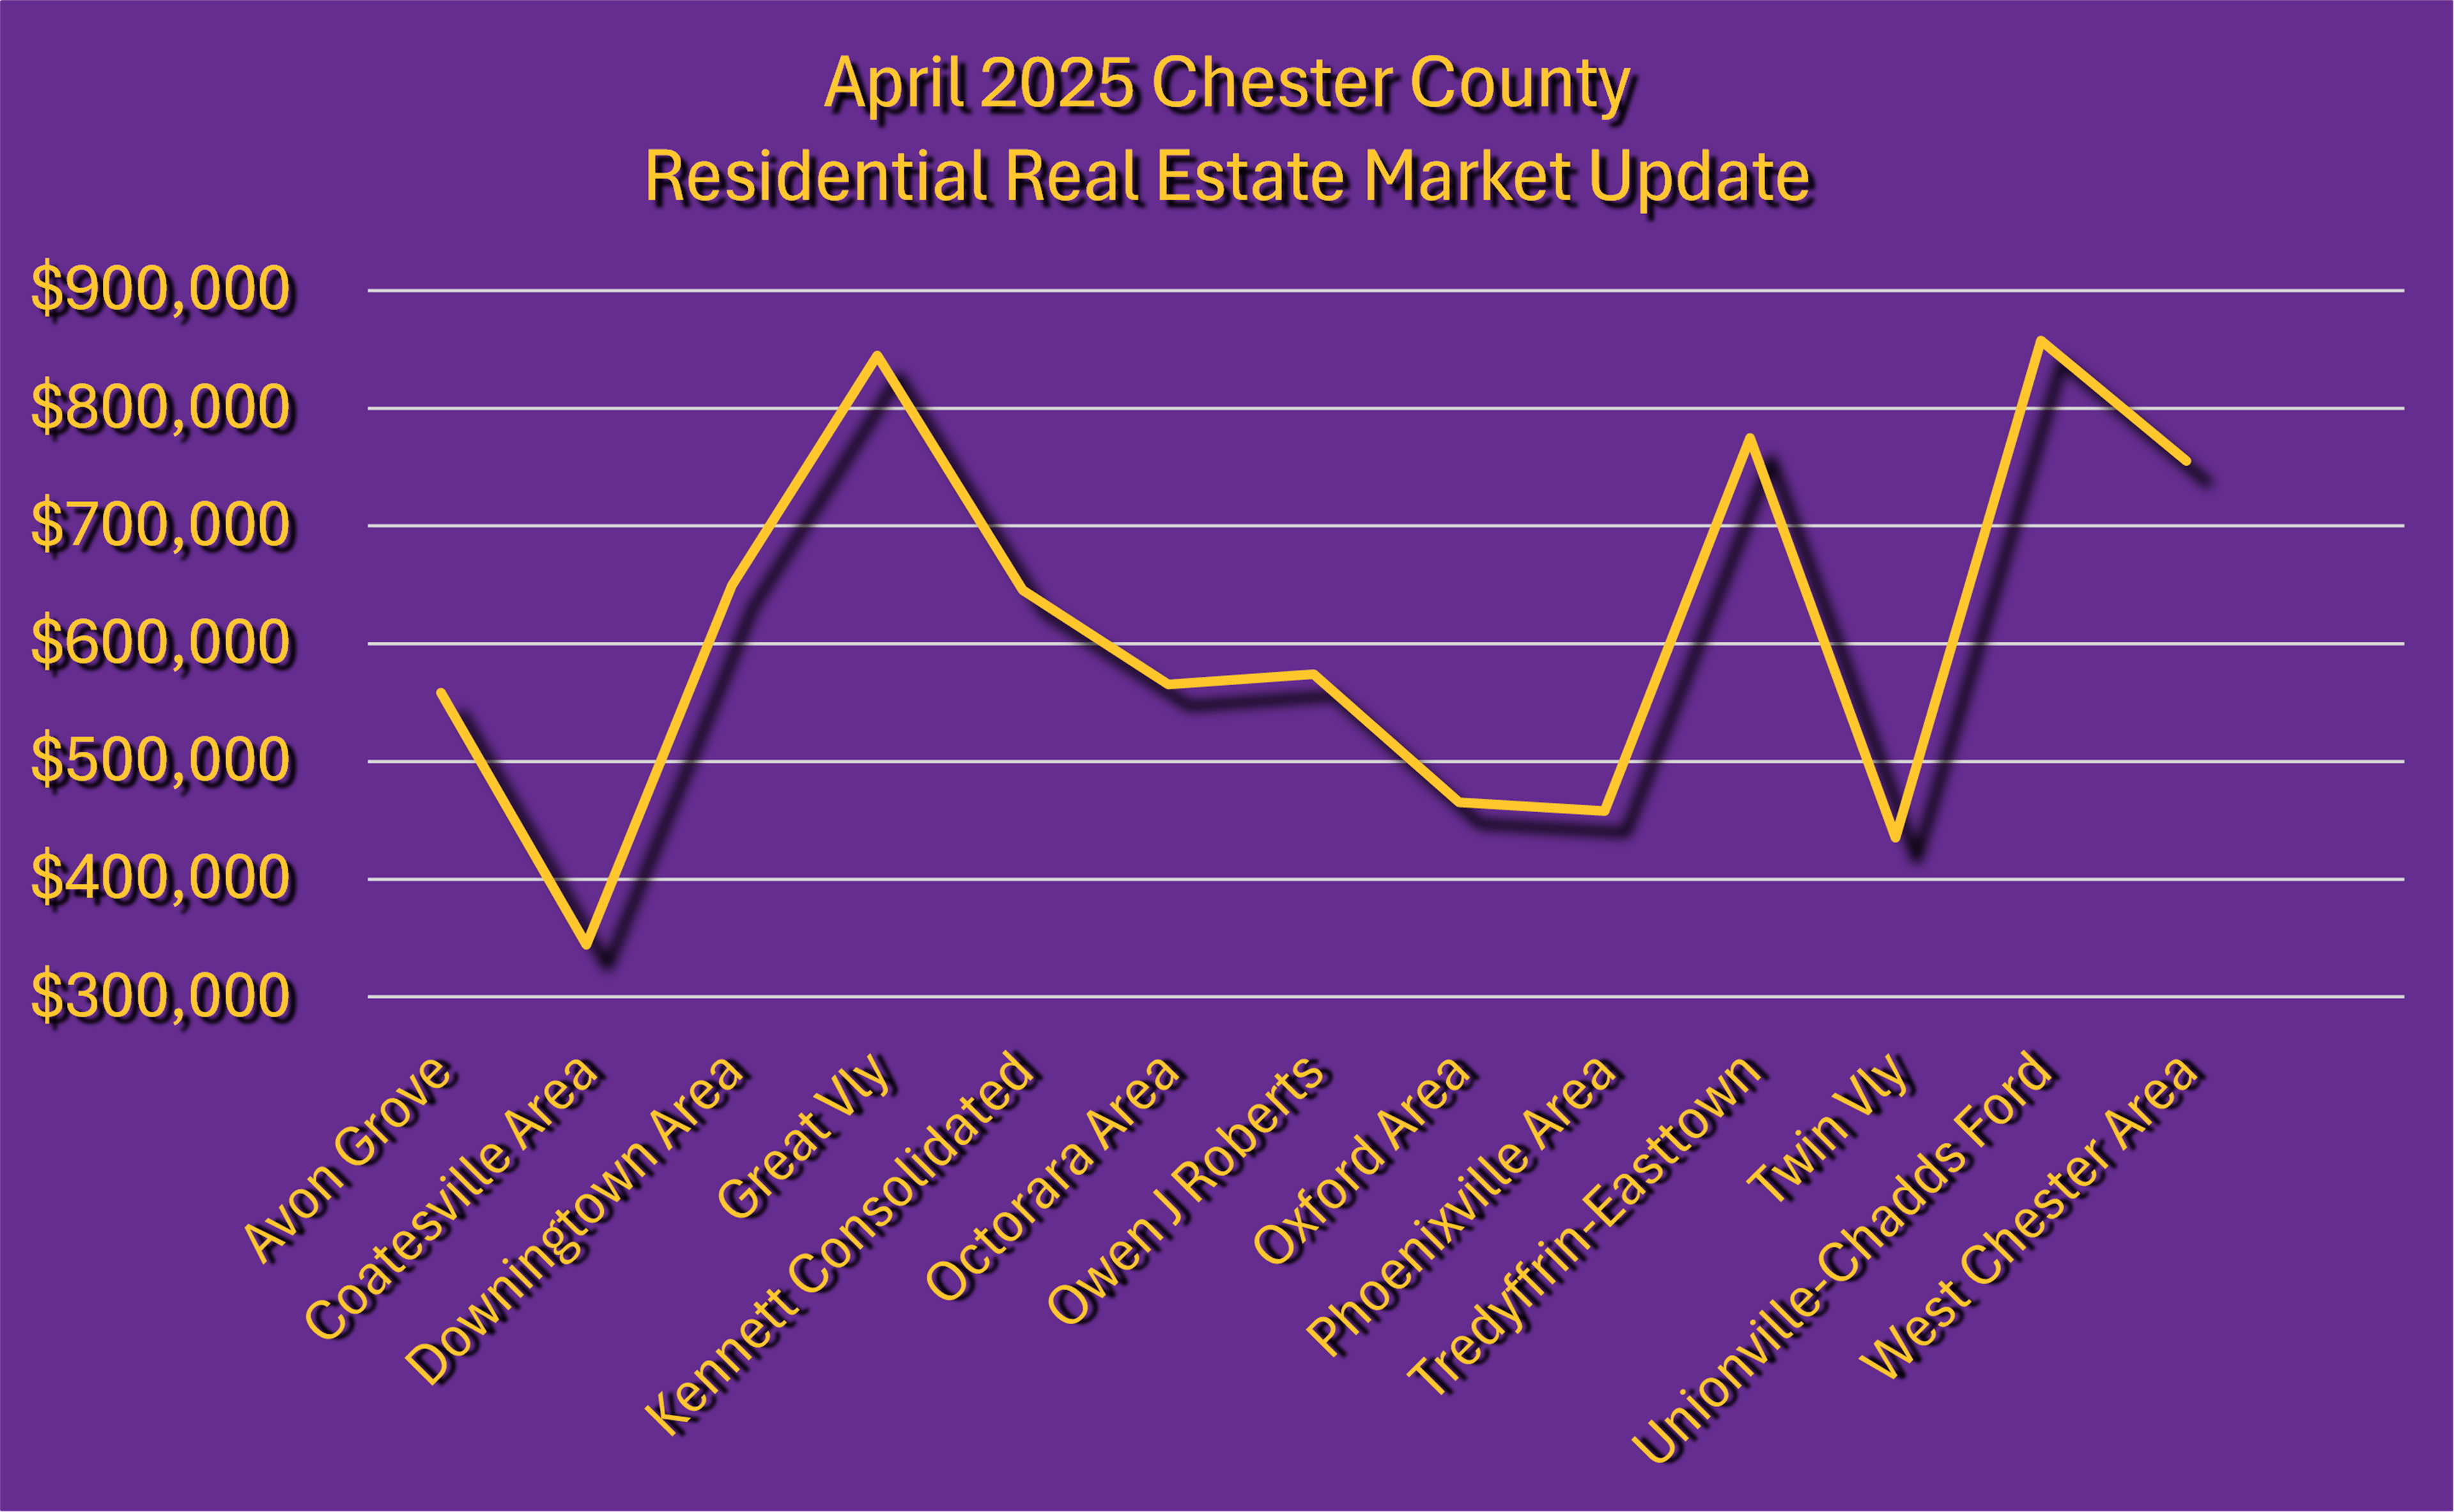
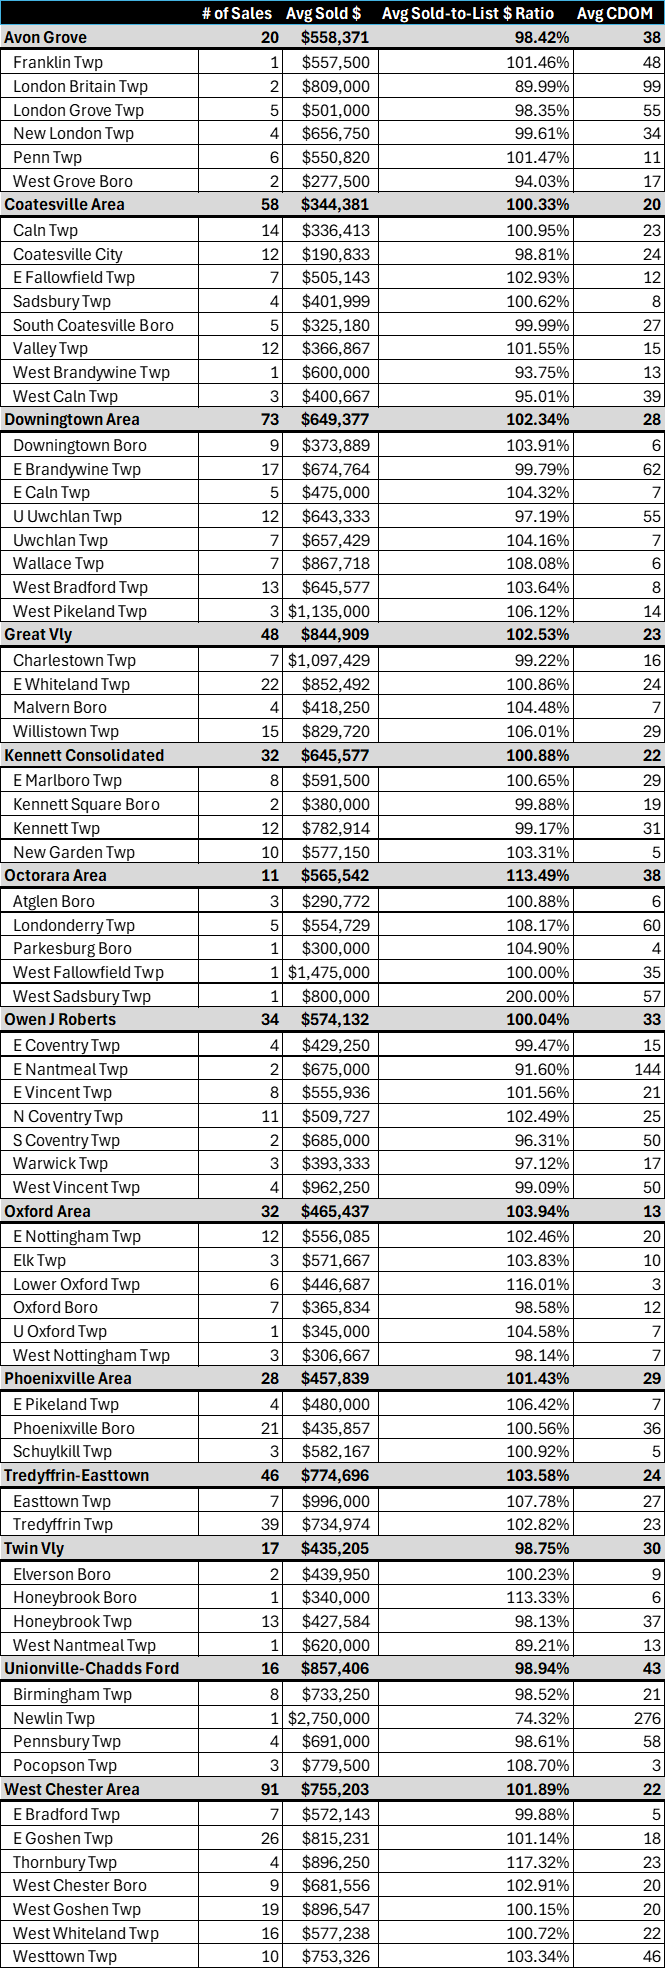
April 2025 Chester County by School District: Closed Sales Overview
Here’s a deeper dive into the performance across Chester County's various school districts in April 2025:
Avon Grove (20 Sales)
- Average Sold Price: $558,371
- Sold Price-to-List Price: 98.42%
- Average Cumulative Days on Market: 38
- Franklin Twp (1 Sale): $557,500 | 101.46% | 48 days
- London Britain Twp (2 Sales): $809,000 | 89.99% | 99 days
- London Grove Twp (5 Sales): $501,000 | 98.35% | 55 days
- New London Twp (4 Sales): $656,750 | 99.61% | 34 days
- Penn Twp (6 Sales): $550,820 | 101.47% | 11 days
- West Grove Boro (2 Sales): $277,500 | 94.03% | 17 days
Coatesville Area (58 Sales)
- Average Sold Price: $344,381
- Sold Price-to-List Price: 100.33%
- Average Cumulative Days on Market: 20
- Caln Twp (14 Sales): $336,413 | 100.95% | 23 days
- Coatesville City (12 Sales): $190,833 | 98.81% | 24 days
- E Fallowfield Twp (7 Sales): $505,143 | 102.93% | 12 days
- Sadsbury Twp (4 Sales): $401,999 | 100.62% | 8 days
- South Coatesville Boro (5 Sales): $325,180 | 99.99% | 27 days
- Valley Twp (12 Sales): $366,867 | 101.55% | 15 days
- West Brandywine Twp (1 Sale): $600,000 | 93.75% | 13 days
- West Caln Twp (3 Sales): $400,667 | 95.01% | 39 days
Downingtown Area (73 Sales)
- Average Sold Price: $649,377
- Sold Price-to-List Price: 102.34%
- Average Cumulative Days on Market: 28
- Downingtown Boro (9 Sales): $373,889 | 103.91% | 6 days
- E Brandywine Twp (17 Sales): $674,764 | 99.79% | 62 days
- E Caln Twp (5 Sales): $475,000 | 104.32% | 7 days
- U Uwchlan Twp (12 Sales): $643,333 | 97.19% | 55 days
- Uwchlan Twp (7 Sales): $657,429 | 104.16% | 7 days
- Wallace Twp (7 Sales): $867,718 | 108.08% | 6 days
- West Bradford Twp (13 Sales): $645,577 | 103.64% | 8 days
- West Pikeland Twp (3 Sales): $1,135,000 | 106.12% | 14 days
Great Valley (48 Sales)
- Average Sold Price: $844,909
- Sold Price-to-List Price: 102.53%
- Average Cumulative Days on Market: 23
- Charlestown Twp (7 Sales): $1,097,429 | 99.22% | 16 days
- E Whiteland Twp (22 Sales): $852,492 | 100.86% | 24 days
- Malvern Boro (4 Sales): $418,250 | 104.48% | 7 days
- Willistown Twp (15 Sales): $829,720 | 106.01% | 29 days
Kennett Consolidated (32 Sales)
- Average Sold Price: $645,577
- Sold Price-to-List Price: 100.88%
- Average Cumulative Days on Market: 22
- E Marlboro Twp (8 Sales): $591,500 | 100.65% | 29 days
- Kennett Square Boro (2 Sales): $380,000 | 99.88% | 19 days
- Kennett Twp (12 Sales): $782,914 | 99.17% | 31 days
- New Garden Twp (10 Sales): $577,150 | 103.31% | 5 days
Octorara Area (11 Sales)
- Average Sold Price: $565,542
- Sold Price-to-List Price: 113.49%
- Average Cumulative Days on Market: 38
- Atglen Boro (3 Sales): $290,772 | 100.88% | 6 days
- Londonderry Twp (5 Sales): $554,729 | 108.17% | 60 days
- Parkesburg Boro (1 Sale): $300,000 | 104.90% | 4 days
- West Fallowfield Twp (1 Sale): $1,475,000 | 100.00% | 35 days
- West Sadsbury Twp (1 Sale): $800,000 | 200.00% | 57 days
Owen J Roberts (34 Sales)
- Average Sold Price: $574,132
- Sold Price-to-List Price: 100.04%
- Average Cumulative Days on Market: 33
- E Coventry Twp (4 Sales): $429,250 | 99.47% | 15 days
- E Nantmeal Twp (2 Sales): $675,000 | 91.60% | 144 days
- E Vincent Twp (8 Sales): $555,936 | 101.56% | 21 days
- N Coventry Twp (11 Sales): $509,727 | 102.49% | 25 days
- S Coventry Twp (2 Sales): $685,000 | 96.31% | 50 days
- Warwick Twp (3 Sales): $393,333 | 97.12% | 17 days
- West Vincent Twp (4 Sales): $962,250 | 99.09% | 50 days
Oxford Area (32 Sales)
- Average Sold Price: $465,437
- Sold Price-to-List Price: 103.94%
- Average Cumulative Days on Market: 13
- E Nottingham Twp (12 Sales): $556,085 | 102.46% | 20 days
- Elk Twp (3 Sales): $571,667 | 103.83% | 10 days
- Lower Oxford Twp (6 Sales): $446,687 | 116.01% | 3 days
- Oxford Boro (7 Sales): $365,834 | 98.58% | 12 days
- U Oxford Twp (1 Sale): $345,000 | 104.58% | 7 days
- West Nottingham Twp (3 Sales): $306,667 | 98.14% | 7 days
Phoenixville Area (28 Sales)
- Average Sold Price: $457,839
- Sold Price-to-List Price: 101.43%
- Average Cumulative Days on Market: 29
- E Pikeland Twp (4 Sales): $480,000 | 106.42% | 7 days
- Phoenixville Boro (21 Sales): $435,857 | 100.56% | 36 days
- Schuylkill Twp (3 Sales): $582,167 | 100.92% | 5 days
Tredyffrin-Easttown (46 Sales)
- Average Sold Price: $774,696
- Sold Price-to-List Price: 103.58%
- Average Cumulative Days on Market: 24
- Easttown Twp (7 Sales): $996,000 | 107.78% | 27 days
- Tredyffrin Twp (39 Sales): $734,974 | 102.82% | 23 days
Twin Valley (17 Sales)
- Average Sold Price: $435,205
- Sold Price-to-List Price: 98.75%
- Average Cumulative Days on Market: 30
- Elverson Boro (2 Sales): $439,950 | 100.23% | 9 days
- Honeybrook Boro (1 Sale): $340,000 | 113.33% | 6 days
- Honeybrook Twp (13 Sales): $427,584 | 98.13% | 37 days
- West Nantmeal Twp (1 Sale): $620,000 | 89.21% | 13 days
Unionville-Chadds Ford (16 Sales)
- Average Sold Price: $857,406
- Sold Price-to-List Price: 98.94%
- Average Cumulative Days on Market: 43
- Birmingham Twp (8 Sales): $733,250 | 98.52% | 21 days
- Newlin Twp (1 Sale): $2,750,000 | 74.32% | 276 days
- Pennsbury Twp (4 Sales): $691,000 | 98.61% | 58 days
- Pocopson Twp (3 Sales): $779,500 | 108.70% | 3 days
West Chester Area (91 Sales)
- Average Sold Price: $755,203
- Sold Price-to-List Price: 101.89%
- Average Cumulative Days on Market: 22
- E Bradford Twp (7 Sales): $572,143 | 99.88% | 5 days
- E Goshen Twp (26 Sales): $815,231 | 101.14% | 18 days
- Thornbury Twp (4 Sales): $896,250 | 117.32% | 23 days
- West Chester Boro (9 Sales): $681,556 | 102.91% | 20 days
- West Goshen Twp (19 Sales): $896,547 | 100.15% | 20 days
- West Whiteland Twp (16 Sales): $577,238 | 100.72% | 22 days
- Westtown Twp (10 Sales): $753,326 | 103.34% | 46 days
If you like what you see...
✅ Sign up for our Newsletter to stay updated on next month’s market trends!
✅ Explore other Market Reports:
In summary, the Chester County residential real estate market in April 2025 continued its robust performance, demonstrating a significant increase in sales volume and consistently quick selling times, even as average and median prices saw slight adjustments. This dynamic market presents both opportunities and challenges, making local expertise more valuable than ever.
Please feel free to reach out if you have any questions or would like a more detailed analysis of specific areas.
*All information in this report has been collected from Bright MLS and is deemed reliable but not guaranteed. The Broker makes no representations or warranties, express or implied, regarding the accuracy, completeness, or reliability of the data provided. This information is subject to errors, omissions, and data entry inaccuracies, including but not limited to those from cooperating brokers participating in Bright MLS. Additionally, this report does not account for off-market transactions, private sales, or transactions conducted outside of Bright MLS.
This report is for informational purposes only and should not be construed as real estate advice. Individual circumstances vary, and real estate decisions should be based on professional guidance tailored to your specific situation. Please contact Trago Realty or your real estate agent to discuss your particular situation and/or needs.