December 16, 2025
November 2025 Downingtown Area School District Residential Real Estate Market Update
📊 Quick Market Snapshot — November 2025
Downingtown Area School District Real Estate Market
- On-Market Residential Transactions Sold: 67 (Up from 60 in October 2025)
- Median Sold Price: $650,000 (Down from $668,743 in October 2025)
- Average Sold Price: $819,187 (Down from $840,785 in October 2025)
- Median Cumulative Days on Market (CDOM): 16 days (Up slightly from 14 days in October 2025)
- Average Cumulative Days on Market (CDOM): 36 days (Down from 42 days in October 2025)
- Median Sold Price-to-Original Price Ratio: 98.87% (Up from 98.42% in October 2025)
- Average Sold Price-to-Original Price Ratio: 100.23% (Down from 101.36% in October 2025)
Welcome to the Trago Realty market update for the Downingtown Area School District (DASD) service area. This report summarizes residential sales activity within the various municipalities of the DASD during November 2025.
November saw the DASD market experience a slight drop in median price, but transactions picked up speed and volume compared to October. While competition remained high, the softening of the average sale-to-list price ratio indicates that strategic buyers are finding slightly more negotiating leverage.
🔑 Market Insights: Price, Velocity, and Competition
November was characterized by an increase in transaction volume and a highly competitive, yet slightly more volatile, pricing environment.
Pricing and Negotiation
- Both the median and average sold prices saw a slight pullback from October's highs.
- The Average Sold Price-to-Original Price Ratio remained above 100% at 100.23%, indicating that, on average, homes still sold for more than their initial asking price.
- Conversely, the Median Ratio increased to 98.87%, showing the typical seller is getting closer to their original list price compared to last month (98.42%).
- Price Reductions were observed on 34 listings, similar to previous trends, with the average reduction being 5.43%, suggesting that sellers must be strategic with their initial list price.
Transaction Volume and Speed
The market successfully closed 67 transactions, a healthy increase over the 60 sales recorded in October.
- While the Median CDOM slightly increased to 16 days, the Average CDOM dropped from 42 days to 36 days.
Financing Snapshot:
The distribution of financing sources remained robust, with cash buyers accounting for more than one in four transactions, a key factor driving price competition.
- Conventional: 46 units (68.66%)
- Cash: 17 units (25.37%)
- Adjustable Rate Mortgage: 2 units (2.99%)
- FHA: 1 unit (1.49%)
- Adjustable Rate Mortgage, Conventional: 1 unit (1.49%)
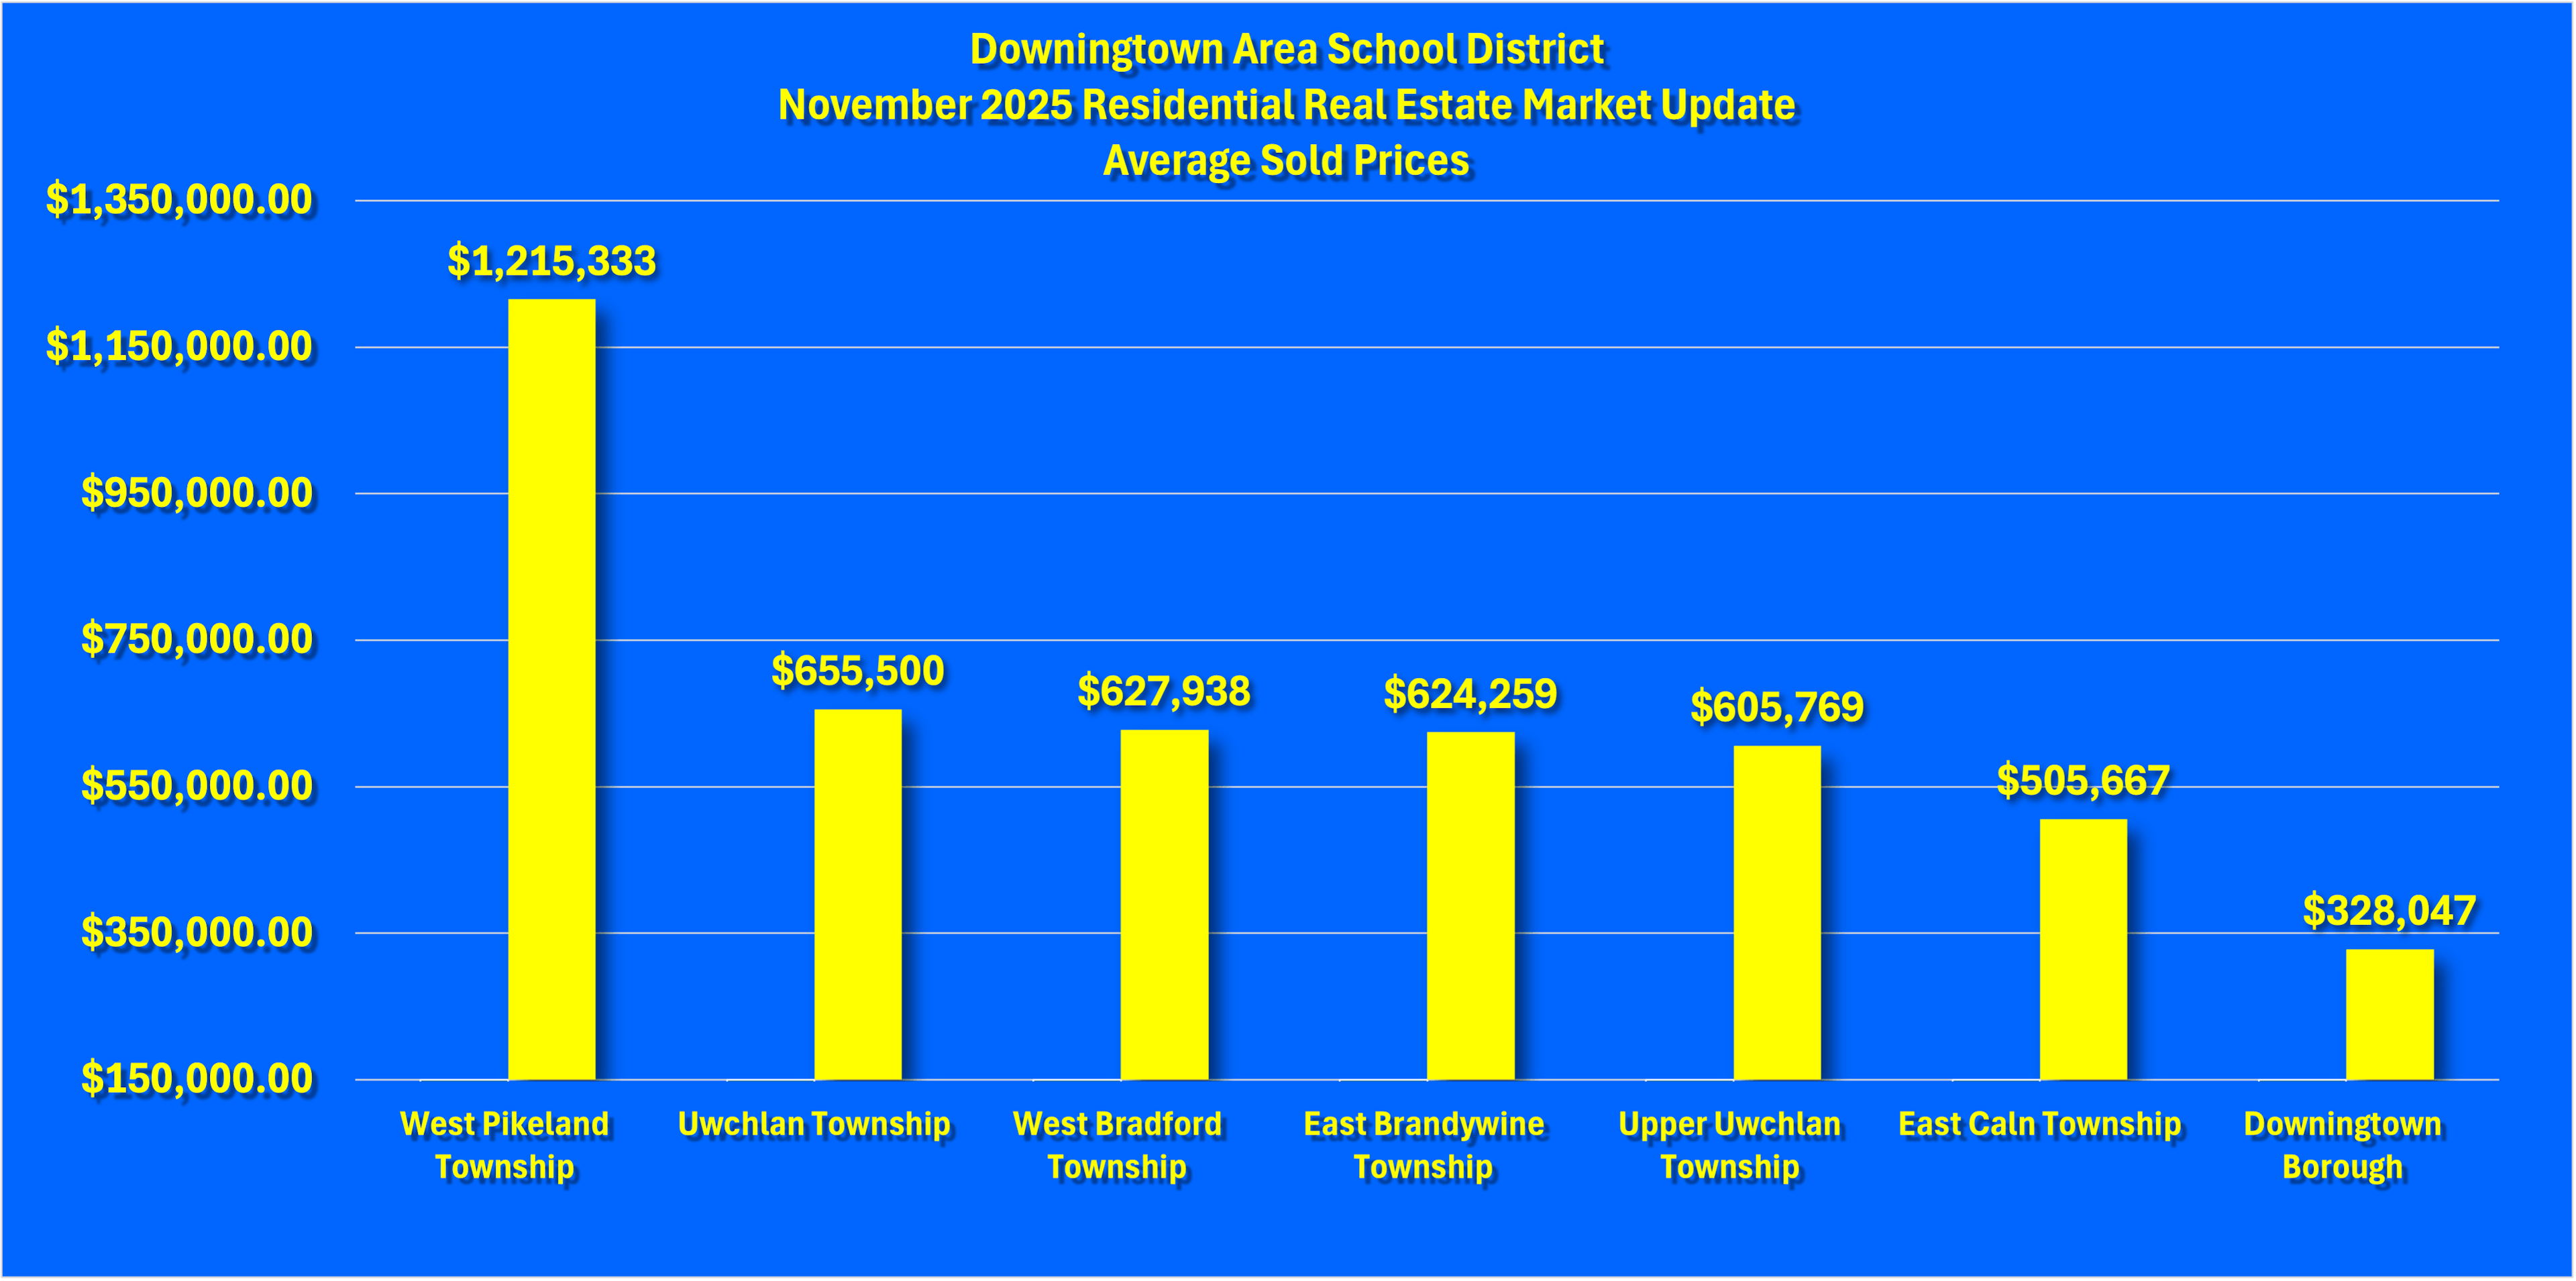
🏡 Market Performance by Township
The DASD continues to feature high-value townships commanding top dollar. West Pikeland Township led the district in average sold price for the second consecutive month.
- West Pikeland Township: 3 Transactions, Average Sold Price: $1,215,333
- Uwchlan Township: 12 Transactions, Average Sold Price: $655,500
- West Bradford Township: 8 Transactions, Average Sold Price: $627,938
- East Brandywine Township: 16 Transactions, Average Sold Price: $624,259
- Upper Uwchlan Township: 13 Transactions, Average Sold Price: $605,769
- East Caln Township: 6 Transactions, Average Sold Price: $505,667
- Downingtown Borough: 9 Transactions, Average Sold Price: $328,047
🏘️ Market Performance by Township & Subdivision
West Pikeland Township – Average $1,215,333
- Unspecified Subdivision: $1,512,500 (2 Sales)
- TWIN HILLS: $621,000 (1 Sale)
Uwchlan Township – Average $655,500
- WINDHAM: $963,000 (1 Sale)
- SWEET CLOVER: $900,000 (1 Sale)
- EAGLEVIEW: $730,000 (3 Sales)
- MARCHWOOD: $665,500 (2 Sales)
- RHONDDA: $435,000 (1 Sale)
West Bradford Township – Average $627,938
- TATTERSALL: $1,108,000 (2 Sales)
- CRESTMONT FARMS: $515,000 (1 Sale)
- TOWNES AT SHANNON HILL: $507,500 (1 Sale)
- STARGAZER VILLAGE: $470,000 (1 Sale)
- MARSHALLTON: $375,000 (1 Sale)
East Brandywine Township – Average $624,259
- AMBLESIDE DOWNS: $825,000 (1 Sale)
- TURNBRIDGE: $707,000 (1 Sale)
- TUNBRIDGE: $650,000 (1 Sale)
- BRANDYWINE WALK: $640,857 (6 Sales)
- STONEMILL VILLAGE: $618,000 (1 Sale)
Upper Uwchlan Township – Average $605,769
- HERON HILL: $930,000 (1 Sale)
- DOWLIN MEADOW: $800,000 (1 Sale)
- WOODLEIGH: $755,000 (1 Sale)
- EAGLE MANOR: $707,500 (2 Sales)
- MARSH HARBOUR: $504,375 (4 Sales)
- BYERS STATION: $419,167 (3 Sales)
East Caln Township – Average $505,667
- WOODMONT: $707,500 (2 Sales)
- DOWNINGTOWN WALK: $520,000 (1 Sale)
- WOODMONT NORTH: $307,000 (2 Sales)
Downingtown Borough – Average $328,047
- DOWNINGTOWN RIDGE: $468,108 (1 Sale)
- ROGER HUNT MILL: $425,000 (1 Sale)
- MAIN STREET VILLAG: $400,000 (1 Sale)
🧭 Summary & Outlook
The November 2025 Downingtown Area School District market shows stability and continued, albeit slightly adjusted, competition. The increase in volume (67 sales) is a positive sign of market fluidity, and the persistent trend of the average home selling above list price (100.23% ratio) confirms strong underlying demand.
- For Buyers: The average time to close has shortened, emphasizing the need for clean, strong offers. Focus on strategically priced homes, as the slight drop in median price suggests opportunities exist away from the highest-end developments.
- For Sellers: The market remains robust. With a high ratio of cash buyers and homes selling for over asking on average, a competitive, data-driven list price is likely to generate a strong and swift sale.
Stay Connected
✅ Sign up for our Newsletter to stay updated on next month’s market trends!
✅ Explore other November 2025 Market Reports:
Data Disclaimer & Disclosure
All information is deemed reliable but not guaranteed for accuracy or completeness. All data and statistics are provided by Bright MLS for the period of November 2025.
The Broker makes no warranties or representations, express or implied, regarding the accuracy or reliability of this data, whether collected directly or provided by Bright MLS or its participants. This information is subject to errors, omissions, and inaccuracies, including, but not limited to, those from data entry.
Additionally, this report does not account for off-market transactions, private sales, or transactions conducted outside of Bright MLS. This report is for informational purposes only and should not be construed as real estate advice. Since individual circumstances vary, all real estate decisions should be based on professional guidance tailored to your specific situation. Please contact Trago Realty or your real estate agent to discuss your particular needs.