December 16, 2025
November 2025 West Chester Area School District Residential Real Estate Market Update
📊 Quick Market Snapshot – November 2025
West Chester Area School District Market Service Area
- Total Transactions: 97 Closed Sales (Down from 104 in October 2025)
- Median Sold Price: $675,000 (Down from $749,950 in October 2025)
- Average Sold Price: $764,025 (Down from $804,212 in October 2025)
- Median Cumulative Days on Market (CDOM): 6 days (Down slightly from 7 days in October 2025)
- Average Cumulative Days on Market (CDOM): 20 days (Down from 24 days in October 2025)
- Median Sale Price-to-Original List Price Ratio: 100.00% (Stable at 100.00% from October 2025)
- Average Sale Price-to-Original List Price Ratio: 99.67% (Up slightly from 99.34% in October 2025)
Welcome to the Trago Realty market update for the highly competitive West Chester Area School District (WCASD) service area. This report summarizes residential sales activity across the townships and the Borough during November 2025, comparing the market's performance to the previous month.
The WCASD market remains highly competitive, maintaining premium pricing power despite the onset of seasonal cooling. Although total transactions dipped, homes continued to sell quickly and, on average, at or above their asking price, confirming sustained, intense buyer demand for this desirable school district.
🔑 Market Insights: Price, Velocity, and Competition
November reinforced the theme of sustained competition in the WCASD, with key metrics remaining firmly in seller territory.
Pricing Power and List Price Ratio
- The Median Sold Price saw a decrease from October.
- The Median Sale Price-to-Original List Price Ratio held firm at 100.00%. This critical metric confirms that the typical home sold this month received its full list price or more.
- The Average Sale Price-to-Original List Price Ratio improved to 99.67%, indicating that, on average, sellers are achieving prices extremely close to their original asking price, leaving very little room for buyer negotiation.
Speed of Sale (Velocity)
Despite the seasonal cooldown in transaction volume, the market speed actually increased month-over-month.
- The Median CDOM dropped to just 6 days, down from 7 days in October. This demonstrates that well-priced homes are going under contract quickly than ever, showcasing the desirability of the area.
- The market recorded 35 listings with price reductions, averaging 4.81% off the original price. This provides limited negotiation opportunities for buyers, but only on properties that may have been initially overpriced.
Financing Snapshot:
The proportion of cash buyers increased significantly in November, a trend that typically indicates higher competition and contributes to strong sale-to-list price ratios.
- Conventional: 71 units (73.20% of transactions)
- Cash: 25 units (25.77% of transactions) - Up significantly from 18.27% in October, representing one in four buyers.
- PHFA: 1 unit (1.03% of transactions)
- Other/Minor Financing Types: Less than 1%
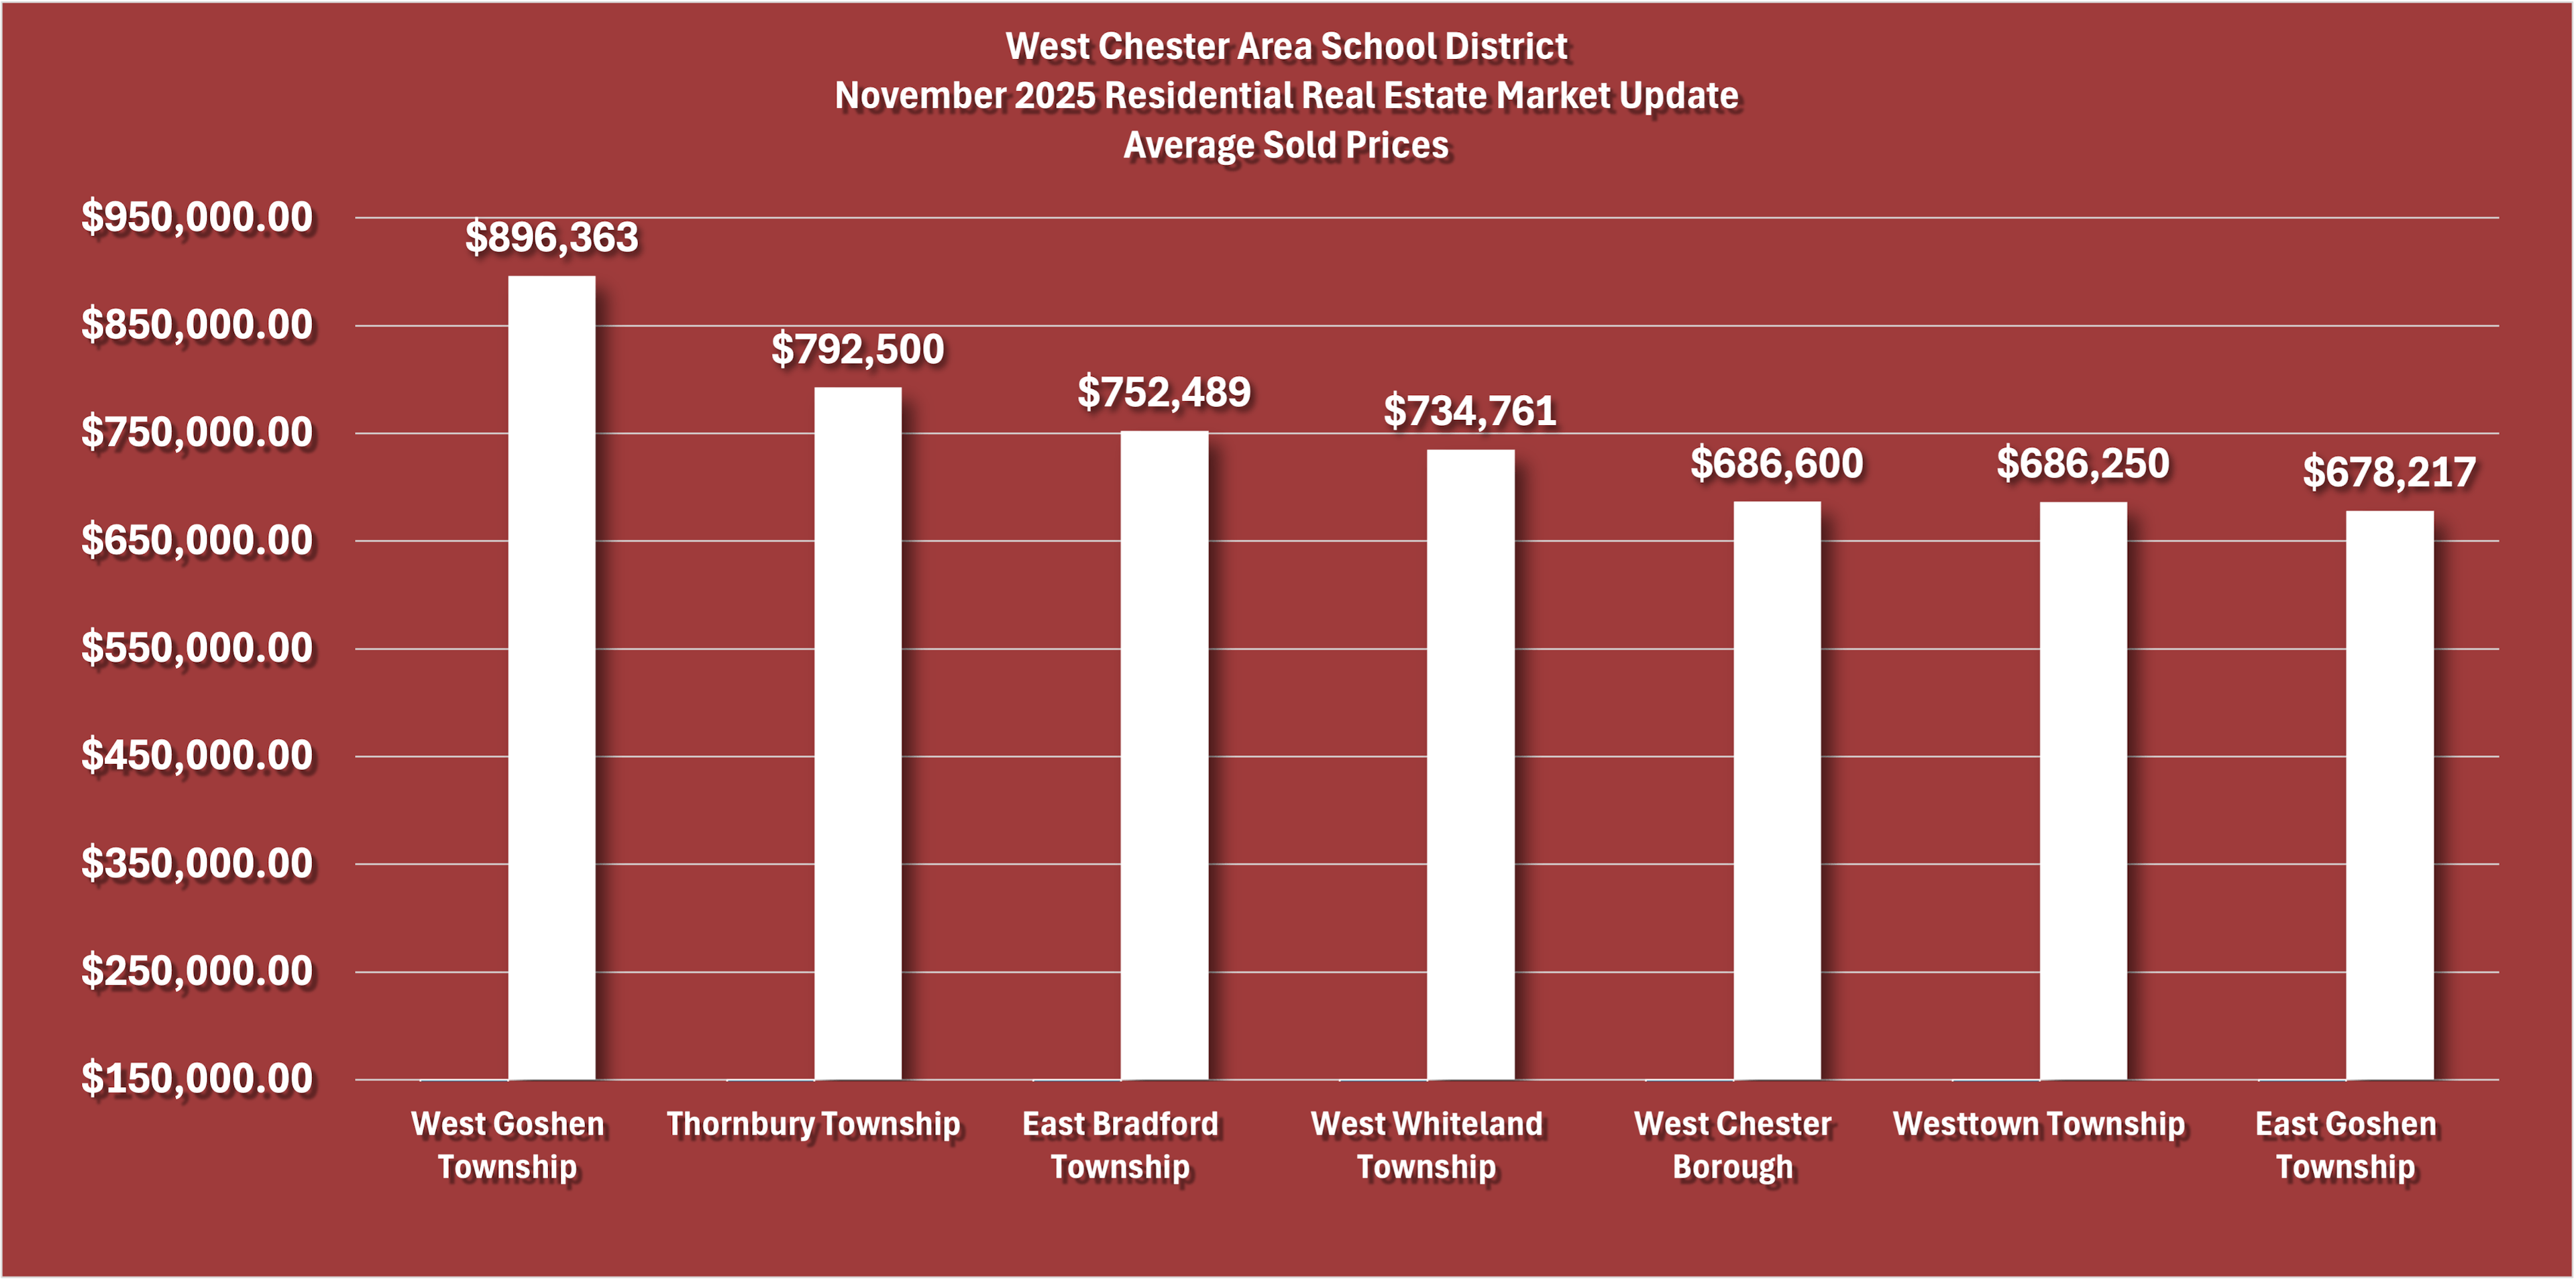
🏡 Market Performance by Township (Ranked by Average Sold Price)
West Goshen Township regained the top spot for average sale price, highlighting the premium value buyers place on its communities.
- West Goshen Township: 26 Transactions, Average Sold Price: $896,363
- Thornbury Township: 8 Transactions, Average Sold Price: $792,500
- East Bradford Township: 9 Transactions, Average Sold Price: $752,489
- West Whiteland Township: 16 Transactions, Average Sold Price: $734,761
- West Chester Borough: 10 Transactions, Average Sold Price: $686,600
- Westtown Township: 10 Transactions, Average Sold Price: $686,250
- East Goshen Township: 18 Transactions, Average Sold Price: $678,217
🏘️ Market Performance by Township & Subdivision (Average Sold Price)
West Goshen Township – Average $896,363
- GREYSTONE: $1,220,513 (10 Sales)
- APPLEGATE: $1,070,000 (1 Sale)
- BROOKFIELD: $1,050,000 (1 Sale)
- BRANDYWINE KNOLL: $915,000 (1 Sale)
- ASHFORD: $830,000 (1 Sale)
Thornbury Township – Average $792,500
- THORNBURY KNOLL: $1,100,000 (1 Sale)
- Unspecified Subdivision: $825,000 (3 Sales)
- CHERRY CREEK: $765,000 (1 Sale)
- THORNBURY: $730,000 (2 Sales)
East Bradford Township – Average $752,489
- BRANDYWINE RIVER E: $995,000 (1 Sale)
- ALLEGIANCE: $980,000 (1 Sale)
- BLUE ROCK MEADOWS: $947,500 (1 Sale)
- Unspecified Subdivision: $782,500 (2 Sales)
West Whiteland Township – Average $734,761
- EXTON WALK SINGLES: $1,144,536 (5 Sales)
- WALTZ LEA: $888,500 (1 Sale)
- LOCHIEL FARM: $691,250 (2 Sales)
- WHITELAND WEST: $620,000 (1 Sale)
East Goshen Township – Average $678,217
- APPLEBROOK: $2,300,000 (1 Sale)
- WATERVIEW: $1,140,000 (1 Sale)
- WEST CHESTER (General): $991,000 (1 Sale)
- Unspecified Subdivision: $905,000 (2 Sales)
🧭 Summary & Outlook
The West Chester Area School District market is exceptionally strong as we head into the year-end. The drop in transaction volume is typical for the season, but the sustained high-velocity (Median CDOM of 6 days) and stable price performance (100.00% Median Sale-to-List Ratio) prove that buyer demand is intense and the supply of desirable homes is critically low.
- For Buyers: You must be fully prepared to act decisively. The presence of a high number of cash buyers and the short time on market (6 days) demand clean, robust offers, particularly in competitive townships.
- For Sellers: The market remains firmly in your favor. With homes selling rapidly and for full asking price or more, November was an ideal month to capitalize on peak demand and minimal inventory competition.
Stay Connected
✅ Sign up for our Newsletter to stay updated on next month’s market trends!
✅ Explore other November 2025 Market Reports:
Data Disclaimer & Disclosure
All information is deemed reliable but not guaranteed for accuracy or completeness. All data and statistics are provided by Bright MLS for the period of November 2025.
The Broker makes no warranties or representations, express or implied, regarding the accuracy or reliability of this data, whether collected directly or provided by Bright MLS or its participants. This information is subject to errors, omissions, and inaccuracies, including, but not limited to, those from data entry.
This report does not account for off-market transactions, private sales, or transactions conducted outside of Bright MLS. This report is for informational purposes only and should not be construed as real estate advice. Since individual circumstances vary, all real estate decisions should be based on professional guidance tailored to your specific situation. Please contact Trago Realty or your real estate agent to discuss your particular needs.